
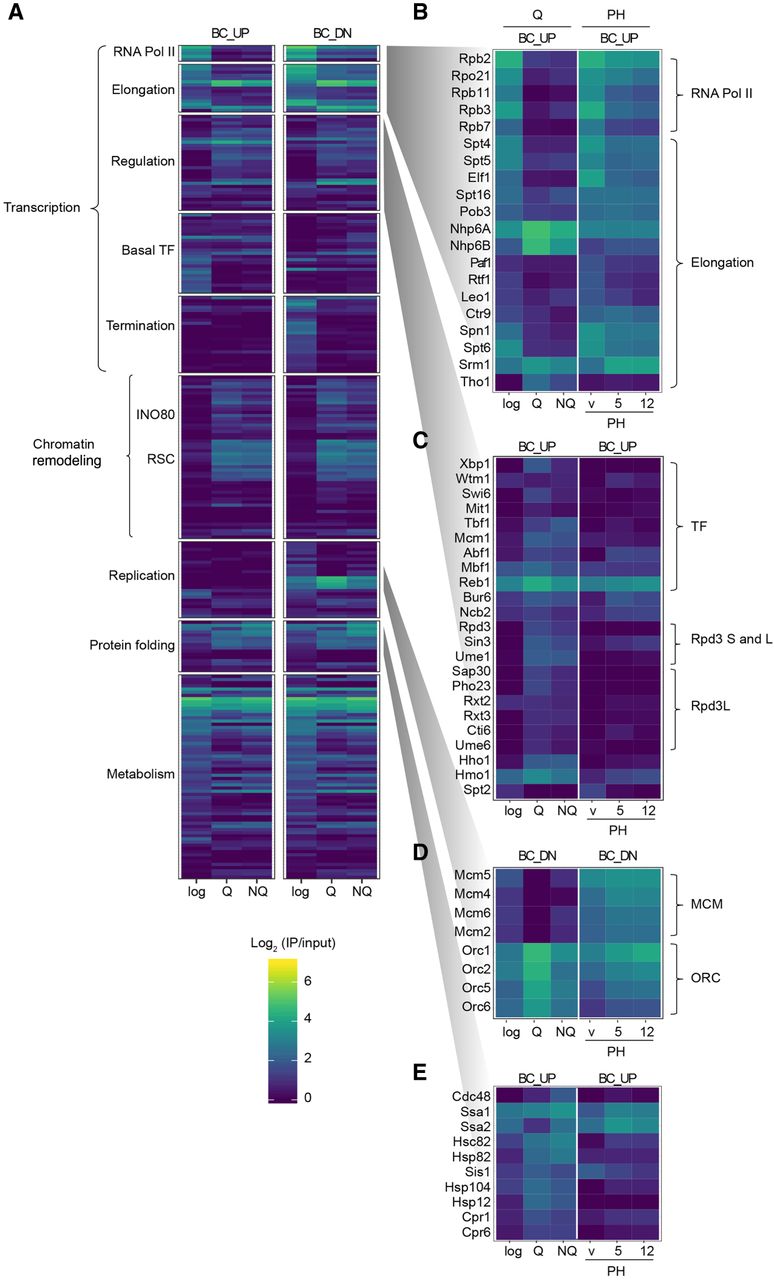
Figure 5.
Chromatin-proteome rewiring upon transcriptional repression in quiescence. (A) Heatmap of the HO Epi-Decoder binding scores in mid-log, Q, and NQ cells (mean IP/input of three biological replicates). For mean binding scores of all proteins examined in the Chrom-3×BC library, see Supplemental Table S3. Proteins were manually clustered and ranked in functional subcategories as in Figure 2C. (B–E) Zoom-in of heatmap of panel A (promoter region BC_UP, except replication for which terminator BC_DN next to the origin of replication was used) showing proteins in the indicated annotated clusters. PH treatment during G1 arrest (vehicle, 5 and 12 min) is shown for comparison.


