
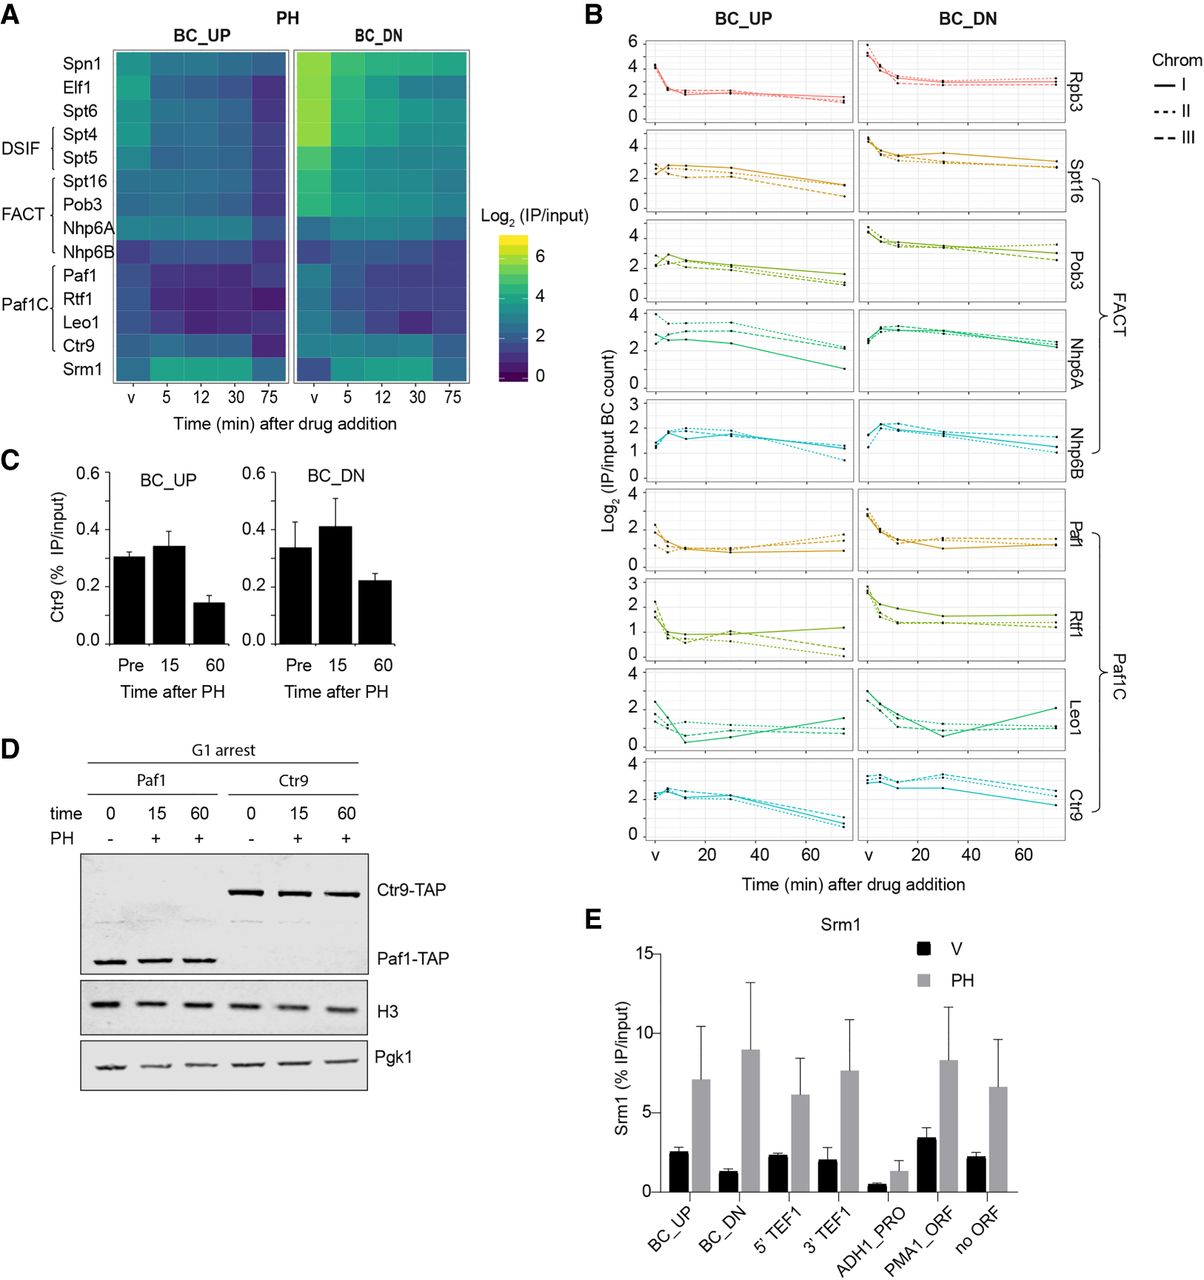
Differential response of transcription elongation factors to chemical inhibition of Pol II. (A) Zoom-in on the heatmap of Figure 2 (PH treatment), showing proteins annotated to transcription elongation. (B) Independent replicates of proteins related to FACT and Paf1C (Log2 IP/input at time points as in Fig. 2). The lines show the three different BC pairs of the indicated TAP-tagged proteins in the Chrom-3×BC library. (C) ChIP-qPCR analysis of Ctr9 binding at the BC_UP and BC_DN regions in G1-arrested cells treated with (15 and 60 min) and without (Pre) PH at 16°C (average of three biological replicates ± SD). (D) Immunoblot analysis of Ctr9-TAP and Paf1-TAP with and without PH treatment in G1-arrested cells at 16°C. Pgk1 and H3 were used as loading controls. (E) ChIP-qPCR analysis of Srm1 binding in G1-arrested cells at 16°C, treated for 15 min with vehicle (V) or PH (average of three biological replicates ± SD). Analyzed loci are the BC_UP and BC_DN regions, the 5′ and 3′ end of the endogenous TEF1 gene, the ADH1 promoter, the PMA1 open reading frame, and a nontranscribed locus (for more details, see Supplemental Table S5; van Welsem et al. 2018).


