
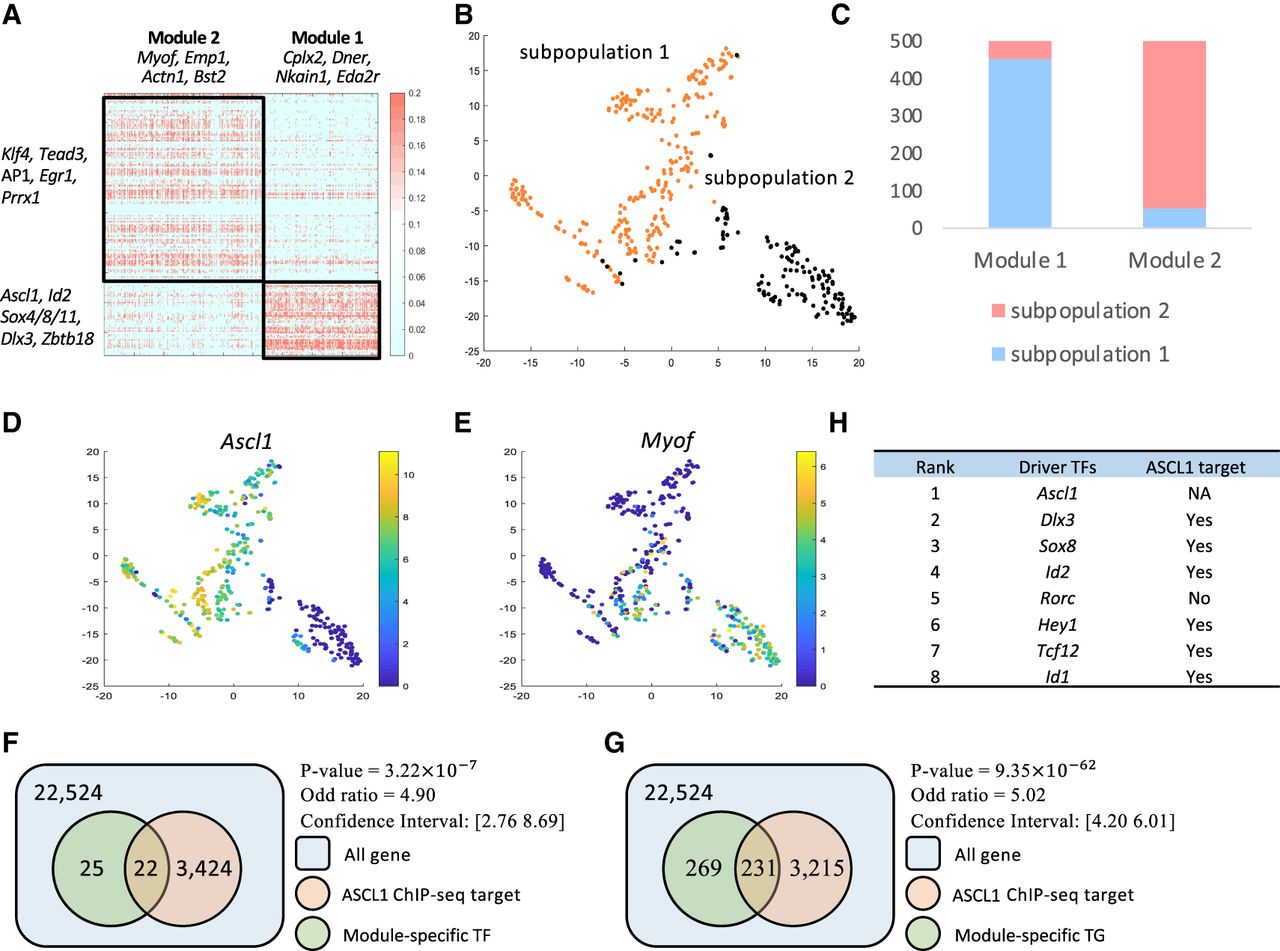
Figure 9.
TimeReg analysis on direct reprogramming from fibroblast to neuron. (A) Heatmap of reordered normalized TRS scores at day 2. The black line represents the detected modules from NMF. (B) t-SNE plot of single-cell RNA-seq data. Color represents clustering label. (C) Distribution of day 2 top 500 module-specific genes’ maximum-expressed subpopulations from single-cell RNA-seq data. (D,E) Expression of module-specific genes on t-SNE plot. (F,G) Module 1–specific genes are enriched in ASCL1 ChIP-seq target genes. (H) List of driver regulators of Module 1 in day 2.


