
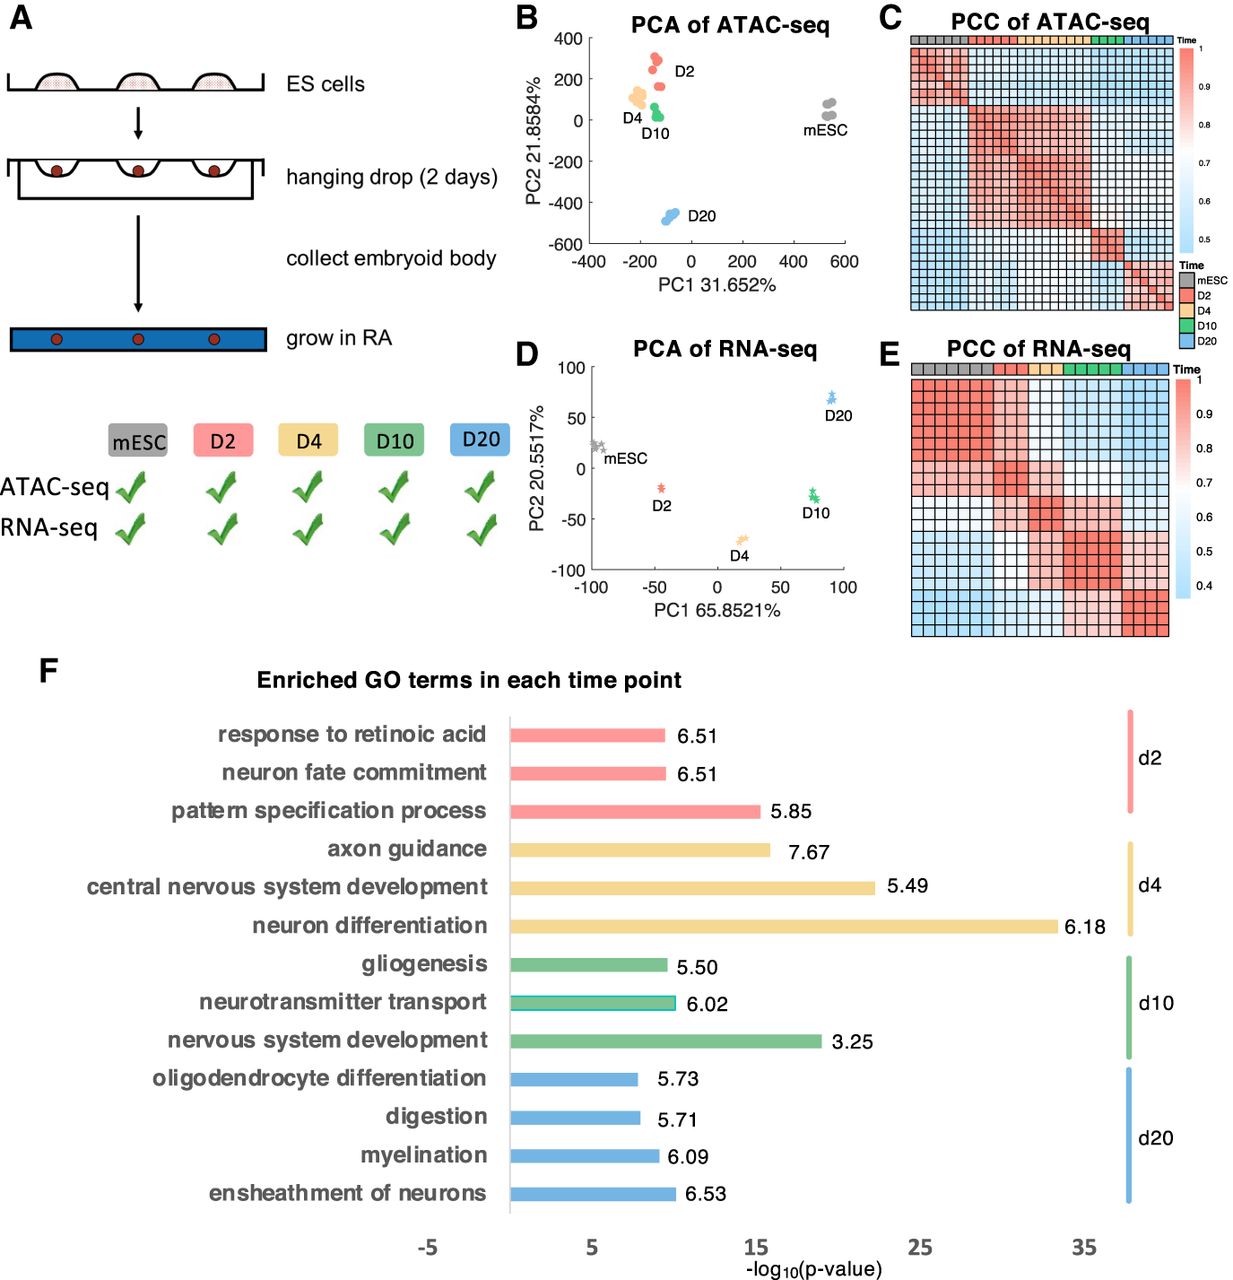
Figure 2.
Genome-wide profiling of gene expression and chromatin accessibility during RA induction reveals landscape for RA-driven lineage transition. (A) Schematic outline of study design. (B,C) PCA and heat map of the Pearson's correlation matrix on ATAC-seq data. (D,E) PCA and heatmap of the Pearson's correlation matrix on RNA-seq data. (F) Enriched GO terms in the top 200 specific genes at each time point. The horizontal axis is −log10(P-value) and the number behind the bar represents fold enrichment.


