
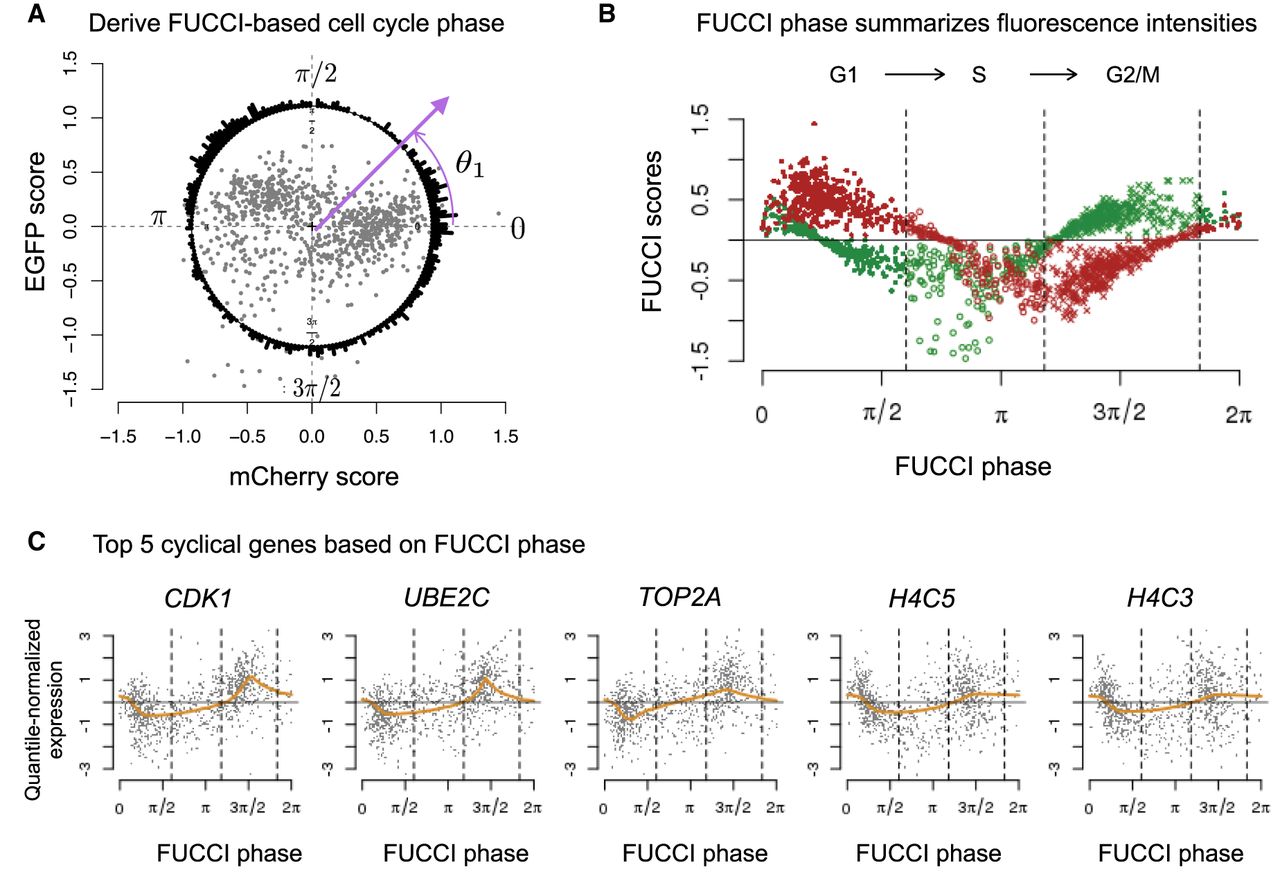
Characterizing cell cycle phase using FUCCI fluorescence intensities. (A) We inferred FUCCI phase (angles in a circle) based on EGFP and mCherry scores. The points in center correspond to the 888 quality single-cell samples. The circle histogram shows the FUCCI phase distribution corresponding to the EGFP (y-axis) and mCherry (x-axis) scores. For example, we inferred θ1 based on the cell's FUCCI scores, namely, inverse tangent function of (EGFP/mCherry). (B) We ordered FUCCI scores of EGFP and mCherry by FUCCI phase to visualize the co-oscillation of EGFP and mCherry along the cell cycle. Red and green points correspond to EGFP and mCherry scores, respectively. The vertical lines correspond to phase boundaries derived from the PAM-based classification (G1, 384 cells; S, 172 cells; G2/M, 332 cells). (C) Given the FUCCI phase, we ordered cells along the cell cycle to estimate the cyclic trend of gene expression levels for each gene. We identified these five genes as the top five cyclic genes in the data: CDK1, UBE2C, TOP2A, H4C5, and H4C3. Each plot shows the expression levels of 888 single-cell samples and the estimated cyclic trend (orange line). All five genes were previously identified as related to cell cycle regulation. The vertical lines correspond to phase boundaries derived from the PAM-based classification.


