
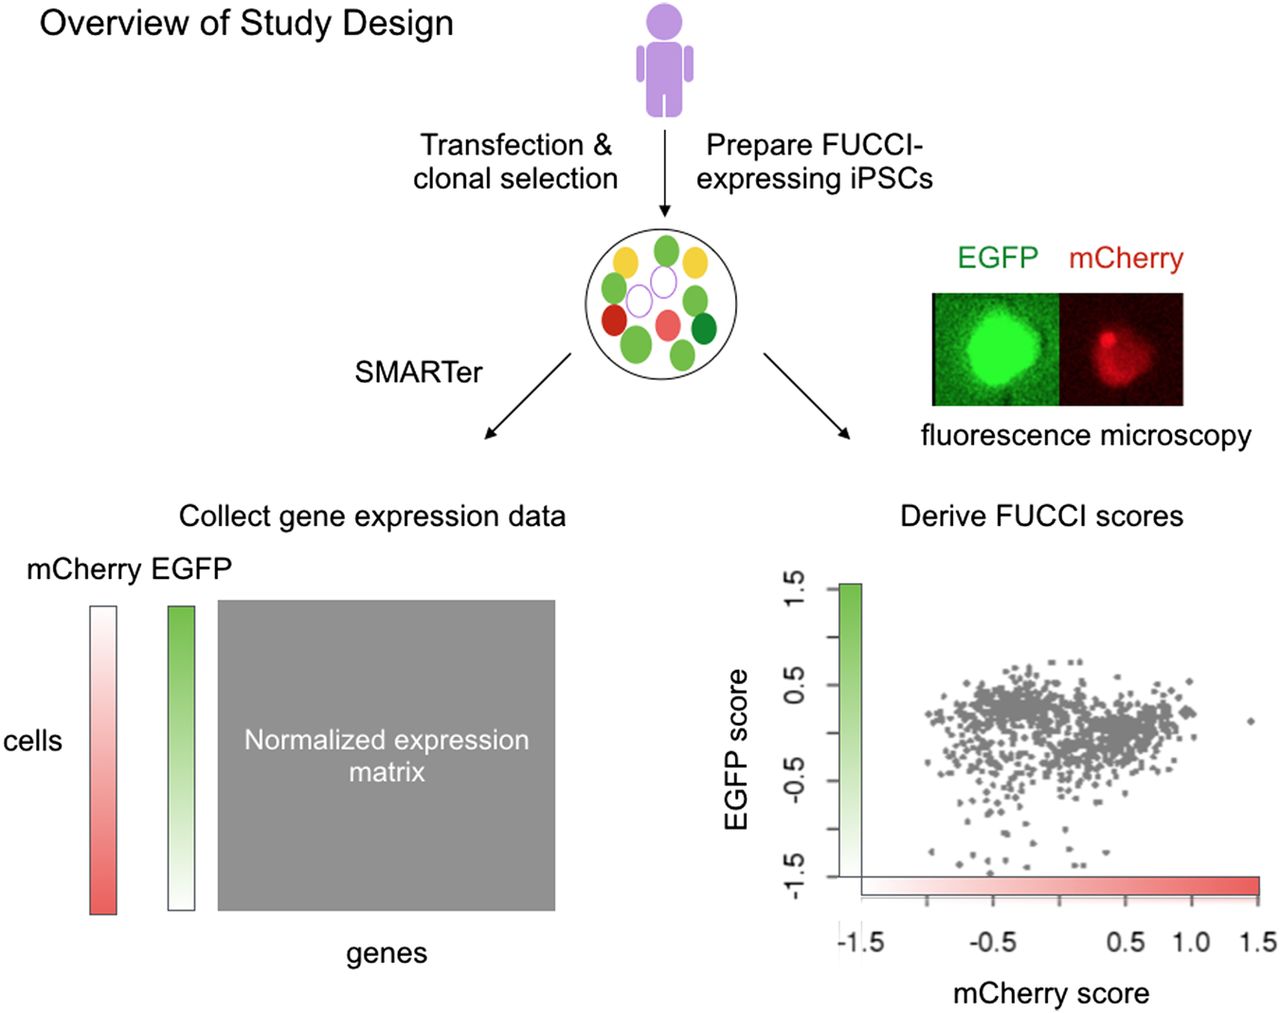
Overview of study design. We collected two types of data from the same single cells using FUCCI-expressing iPSCs: in situ fluorescence images and scRNA-seq. After quality control, we obtained 888 single cells for which we had high-quality RNA-seq data. We computed two FUCCI scores for each cell by individually summing the EGFP (green) and mCherry (red) intensities in a fixed cell area (100 × 100 pixels), correcting for background noise outside the defined cell area, and then taking the log10 transformation of the sum of corrected intensities. In the bottom right scatter plot, we show the FUCCI scores for the 888 high-quality single-cell samples, namely, mCherry and EGFP log10 sum intensities after background noise correction. Finally, we standardized the molecule counts to counts per million (CPM) and transformed the data per gene to a standard normal distribution.


