
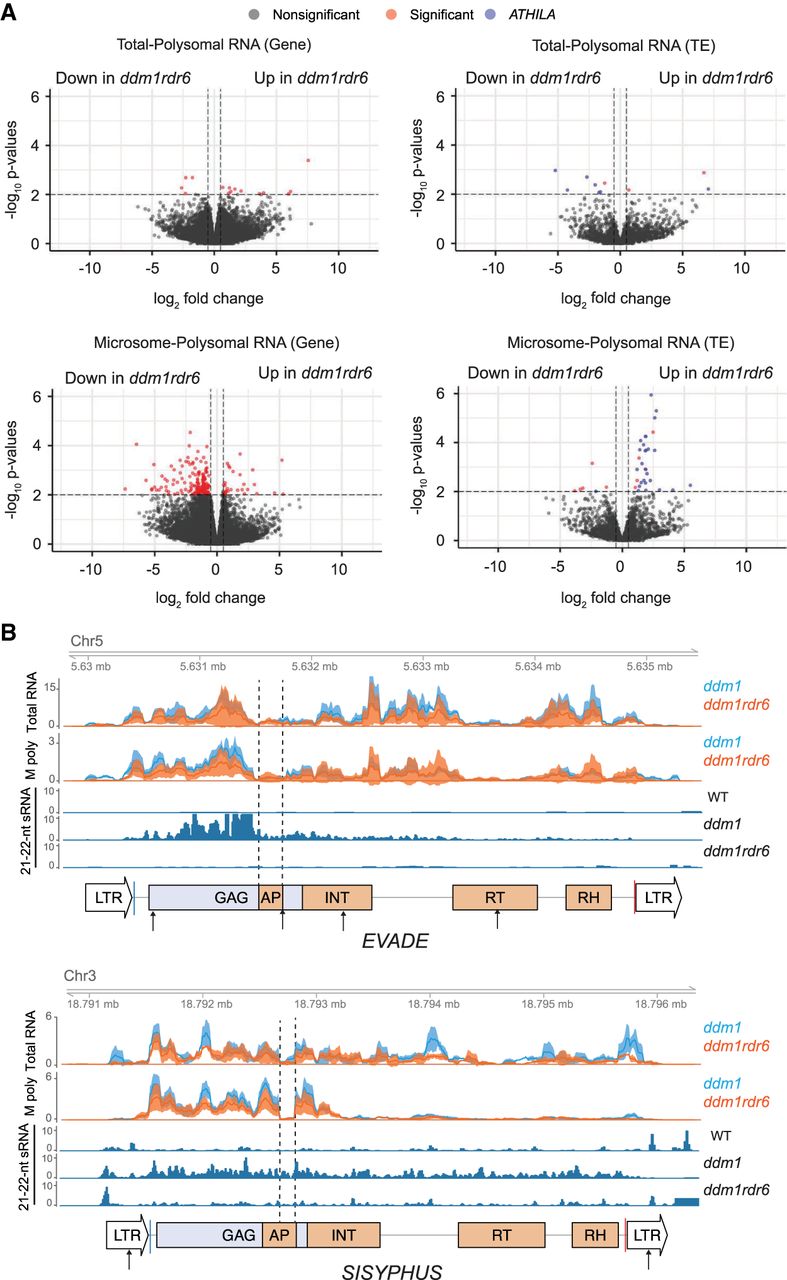
Translatome profiles of ddm1 and ddm1rdr6. (A) Differential analysis of polysomal RNA-seq data between ddm1 and ddm1rdr6. Polysomal RNA-seq values were normalized by total RNA seq values to reflect polysomal enrichment (Methods). Red dots indicate significantly regulated genes or transposable elements (TEs) by cut-off values of |log2(fold-change)| > 0.5 and P-values < 0.01 which include ARF4 as an internal control. Significantly regulated ATHILA family elements are labeled with blue dots. (B) Total RNA and microsome-polysomal RNA (M poly) levels are shown for EVADE (AT5TE20395) and SISYPHUS (AT3TE76225). Mean RPM mapped reads and 95% confidence intervals of three biological replicates are shown for ddm1 (blue) and ddm1rdr6 (orange). Conserved protein domains, PBS and PPT, small RNA profiles, and miRNA target sites are indicated as in Figure 1.


