
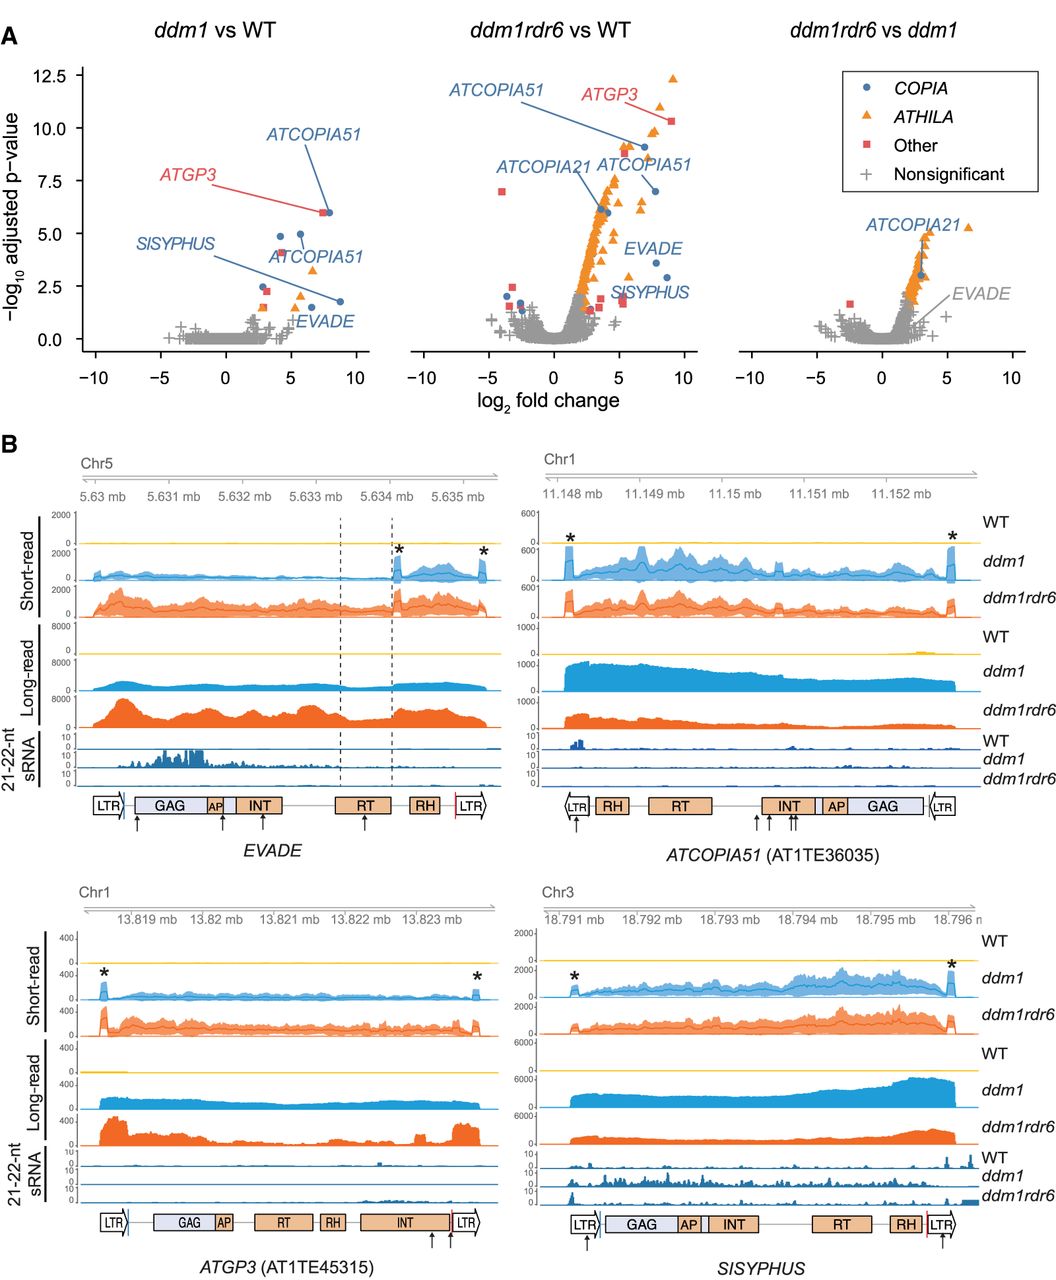
VLP DNA-seq data of LTR retrotransposons in ddm1 and ddm1rdr6. (A) Differential analysis of paired-end sequencing of VLP DNA using Illumina short-read platform. The statistical significance of three comparisons of wild type (WT), ddm1, and ddm1rdr6 is shown with |log2(fold-change)| ≥ 2 and FDR threshold at 5%. Each point corresponds to an annotated transposable element. Multiple ATHILA subfamilies were combined and labeled as “ATHILA.” (B) Coverage of short- and long-read VLP DNA-seq at representative LTR retrotransposon loci (EVADE, AT5TE20395; ATGP3, AT1TE45315; ATCOPIA51, AT1TE36035; SISYPHUS, AT3TE76225) were plotted for ddm1 and ddm1rdr6. Mean read counts per million mapped reads and 95% confidence intervals of biological replicates are shown for WT (yellow; n = 3), ddm1 (blue; n = 2), and ddm1rdr6 (orange, n = 3) short-read libraries. VLP DNA replicate samples were pooled for each genotype and sequenced in aggregate by ONT long-read sequencing. In the LTR retrotransposon annotation, abbreviations for conserved protein domains within the GAG-POL ORF are as follows: (AP) amino peptidase, (INT) integrase, (RT) reverse transcriptase, and (RH) RNase H. Blue and red lines indicate primer binding sites (PBSs) and polypurine tracts (PPTs). The 21- to 22-nt small RNA (sRNA) data were obtained from a previous study (Creasey et al. 2014). Target positions of miRNAs are indicated as arrows (for details, see Supplemental Table S4). Central PPT (cPPT) positions are indicated as dashed lines. Elevated coverage at the edges of strong-stop intermediate and flap DNA is shown as asterisks above ddm1 short-read data.


