
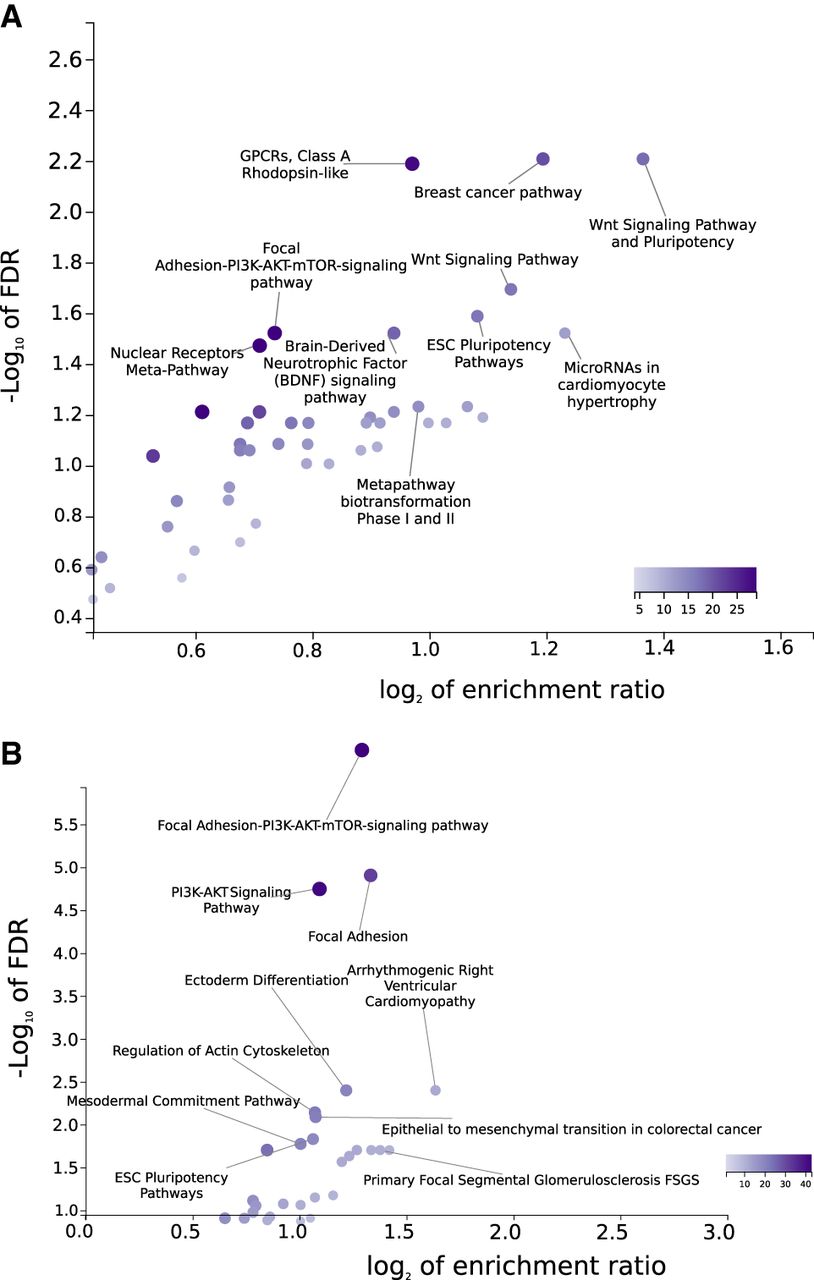
Figure 2.
Pathway enrichment analysis of 1434 protein-coding genes (A) and 848 genes (B) nearby avian conserved genomic regions that show heterogeneity of substitution rates across branches that are grouped according to their beak shape morphological change rates. False discovery rate (FDR) and enrichment ratio stem from the pathway enrichment analysis in WebGestalt (Wang et al. 2017) using all analyzed genes and human annotations, because these are the most comprehensive annotation databases to date. The color of the dots is denoted in the color scale and proportional to the category size, as defined by WebGestalt.


