
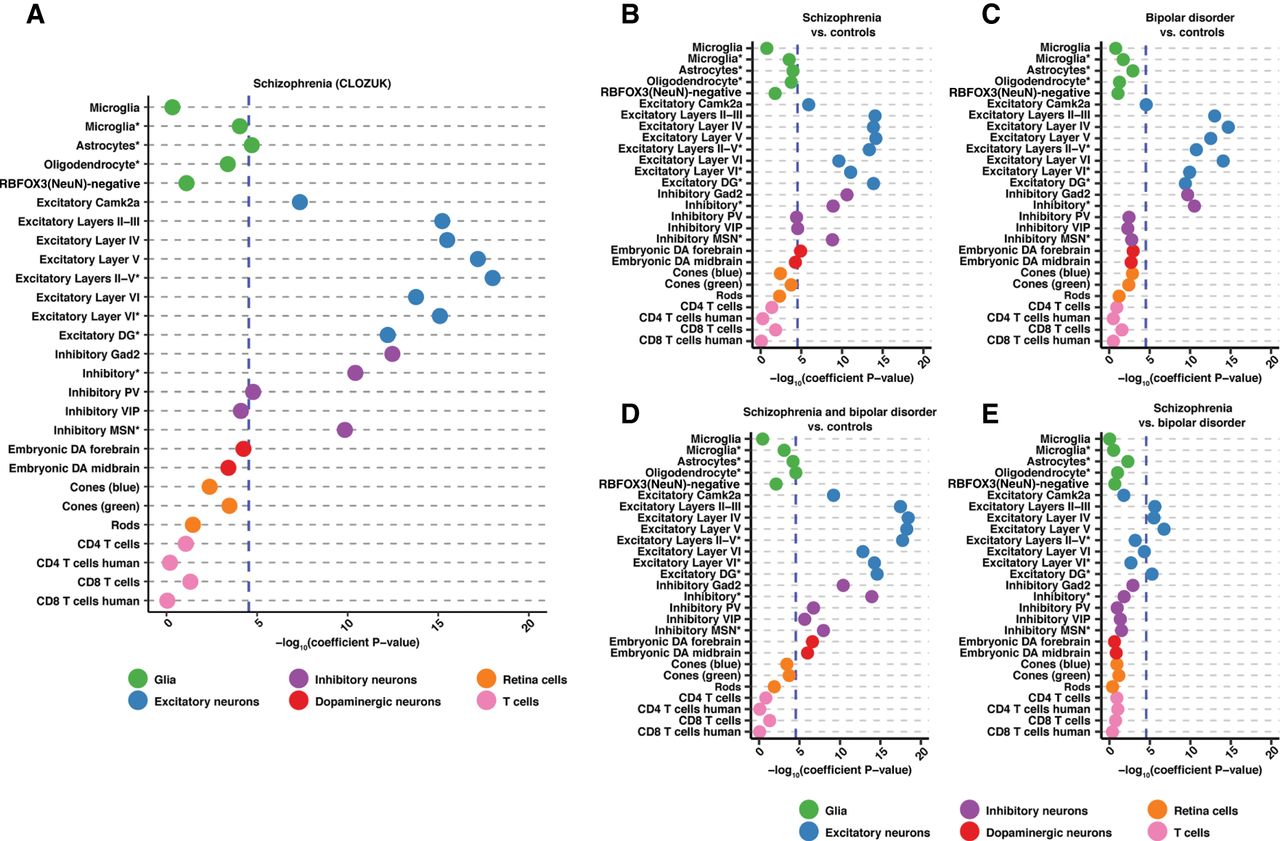
S-LDSC results for CLOZUK and PGC schizophrenia studies as well as bipolar disorder GWAS reveal excitatory cortical neuron enrichment. (A–E) Dotplots displaying the −log10(heritability coefficient P-values) S-LDSC results for: (A) CLOZUK schizophrenia GWAS, (B) PGC schizophrenia GWAS, (C) PGC bipolar disorder GWAS, (D) schizophrenia and bipolar disorder GWAS, and (E) PGC schizophrenia versus bipolar disorder GWAS. Across trait significance levels are shown (−log10[coefficient P-values] = 4.53857; blue dashed line). Populations are colored and ordered by broader cell-type category. Asterisks in the cell population name indicate single-nuclei ATAC-seq data. All results can be found in Supplemental Table S6.


