
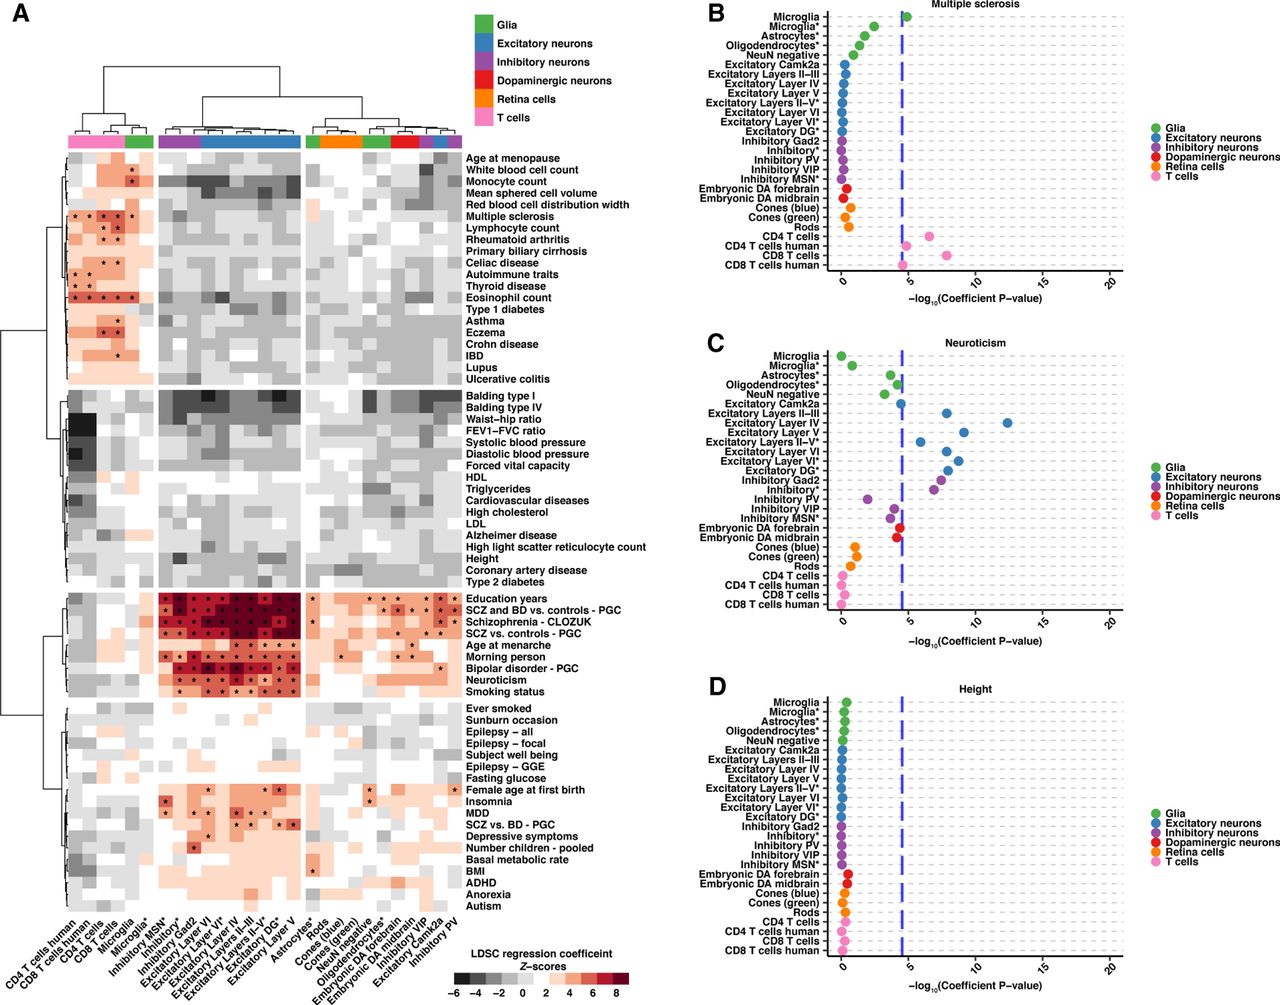
S-LDSC results from 64 GWAS show heritability enrichment in expected cell populations and reveal further insight into disease. (A) A heatmap displaying regression coefficient Z-scores for 27 cell populations across 64 GWAS analyzed. Data are hierarchical clustered by GWAS and cell population. Cell populations that met the across trait significance level (Z-score = 4.02133, which is equivalent to a −log10[coefficient P-value] = 4.53857) are indicated with an asterisk. (B–D) Example dotplots displaying −log10(heritability coefficient P-values) S-LDSC results for GWAS indicative of the observed clustering groups: (B) multiple sclerosis, (C) neuroticism, and (D) height. Across trait significance levels are shown (−log10[coefficient P-value] = 4.53857; blue dashed line). Populations are colored and ordered by broader cell-type category. Asterisks in the cell population name indicate single-nuclei ATAC-seq data. All results can be found in Supplemental Table S6.


