
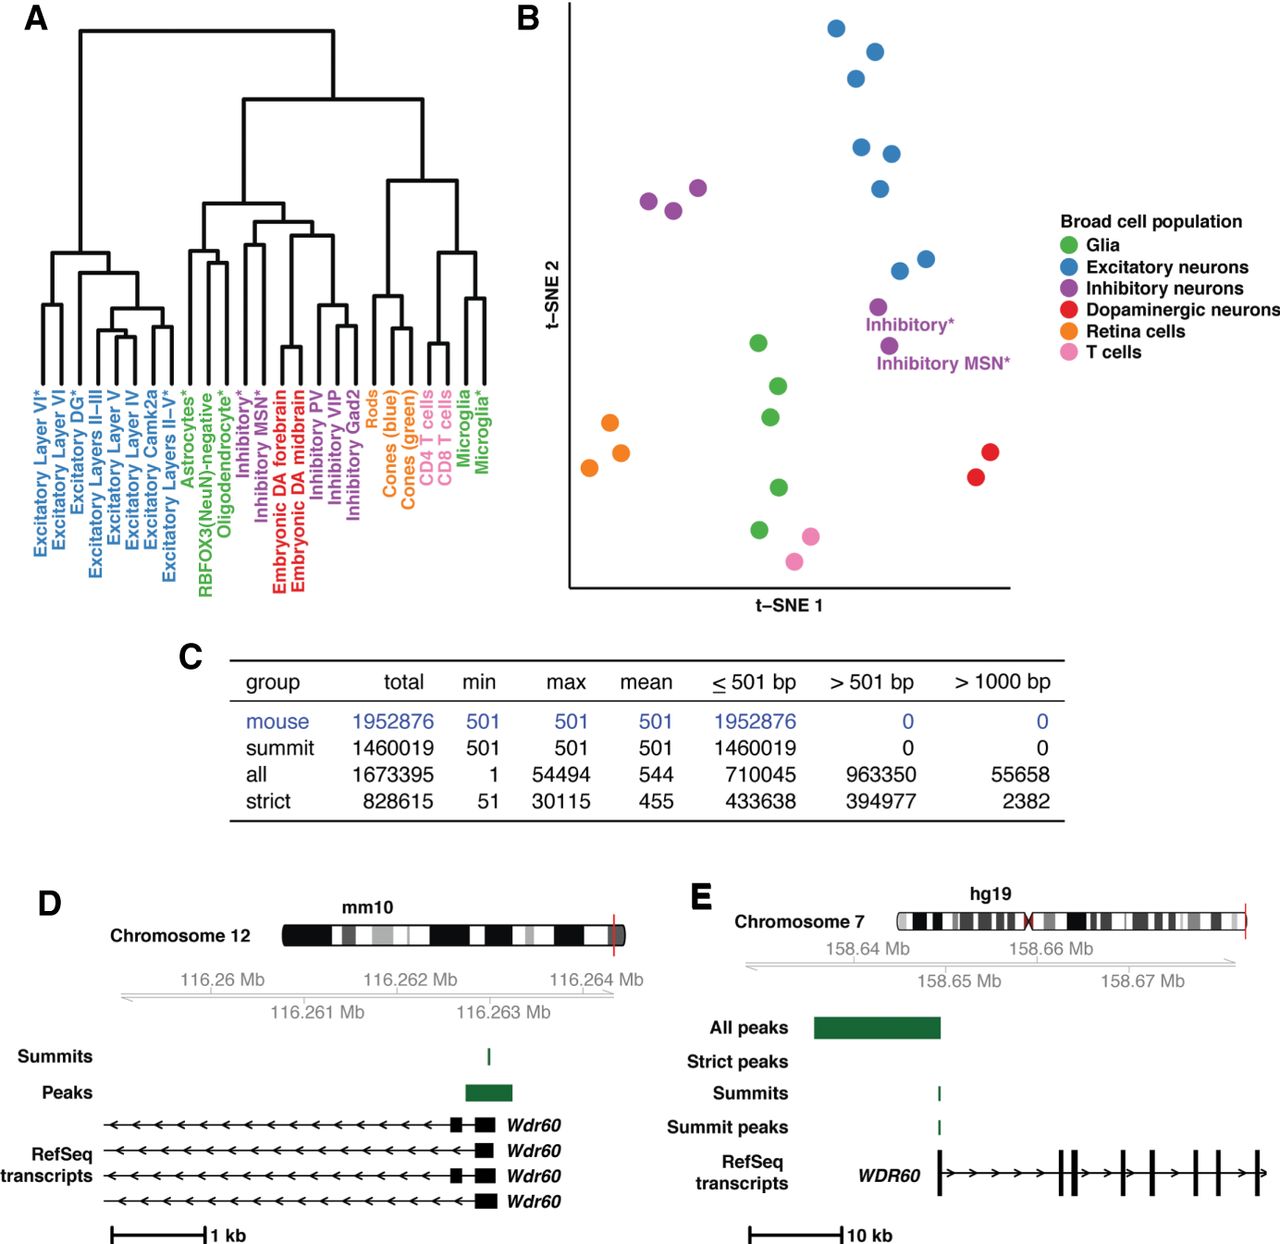
Mouse open chromatin profiles show expected relationships (A,B) and liftOver of mouse peaks to human is best done with summits (C–E). (A) Dendrogram displaying results of hierarchical clustering of the peak count correlations of public, mouse ATAC-seq data. Asterisks in the cell population name indicate single-nuclei data sets. (B) t-SNE plot displaying relationships between the peak counts of mouse cell populations. (C) Table containing the summary of three liftOver strategies applied to public mouse ATAC-seq data. (D) Mouse ATAC-seq data at the Wdr60 promoter region in the mouse genome (mm10; Chr 12: 116,258,915–116,264,450). As an example of the data at this locus, summits and peaks from Excitatory Layers II-III are displayed along with RefSeq transcripts. (E) Mouse-derived human open chromatin data at the WDR60 promoter region in the human genome (hg19; Chr 7: 158,626,991–158,682,822). As an example of data at this locus, data from Excitatory Layers II-III are displayed along with human RefSeq transcripts. Data include results from all three liftOver strategies employed (“All peaks”, “Strict peaks”, and “Summits”) along with the peak created after summit liftOver.


