
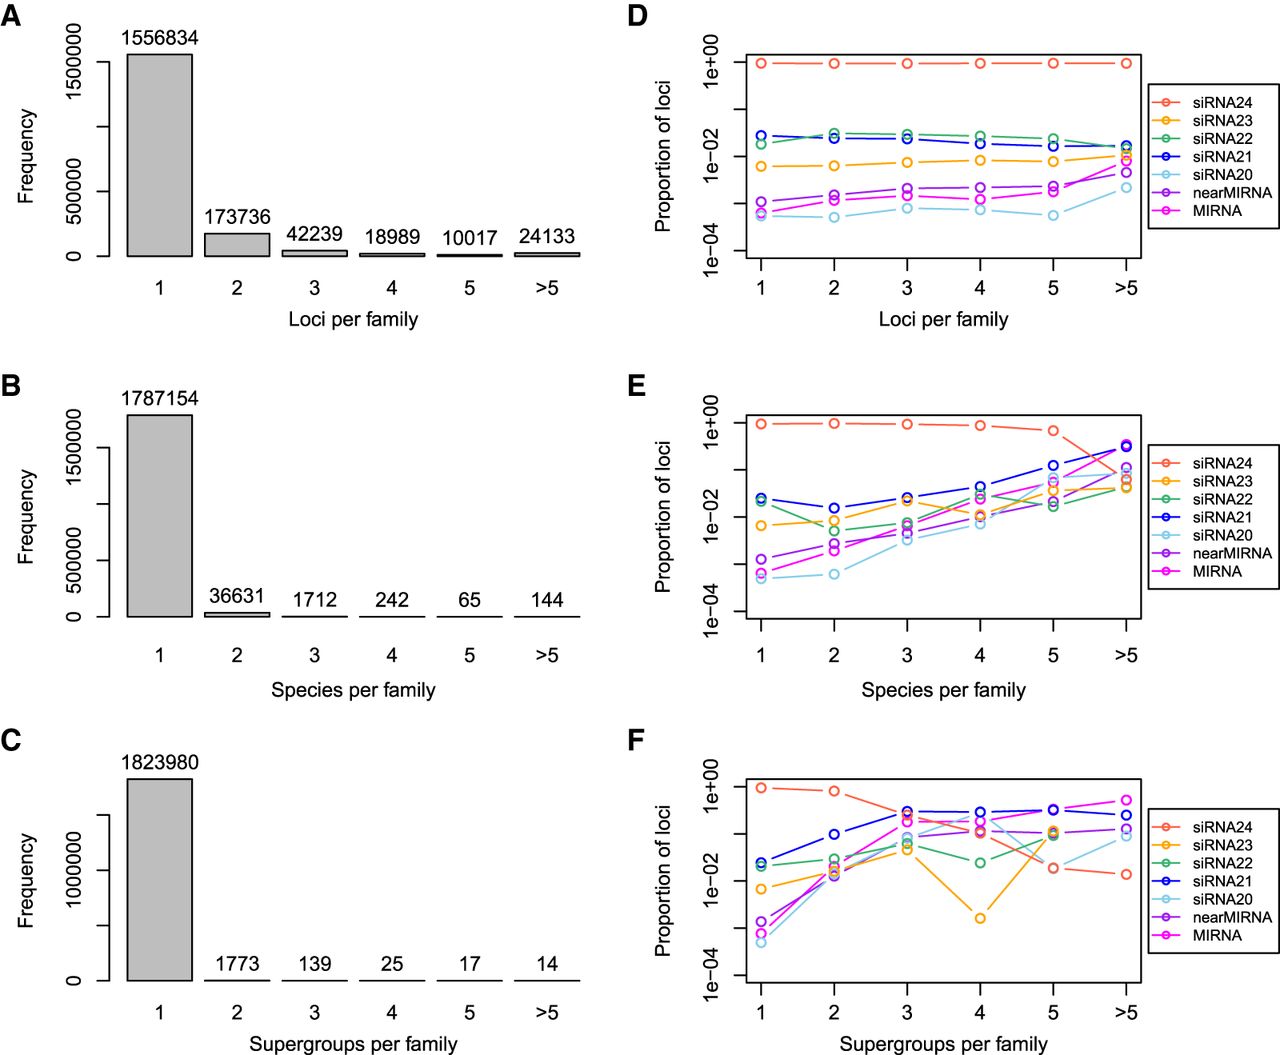
Figure 7.
Conservation of sRNA loci in plants. (A) Frequency distribution of number of sRNA loci per putative sRNA family. (B) Frequency distribution of number of distinct plant species per putative sRNA family. (C) Frequency distribution of number of plant “supergroups” per putative sRNA family. The supergroups defined in this study are rosids, asterids, other eudicots, monocots, basal angiosperms, gymnosperms, and bryophytes. (D) Proportions of types by number of loci per putative sRNA family. (E) Proportions of types by number of distinct plant species per putative sRNA family. (F) Proportions of types by number of plant “supergroups” per putative sRNA family.


