
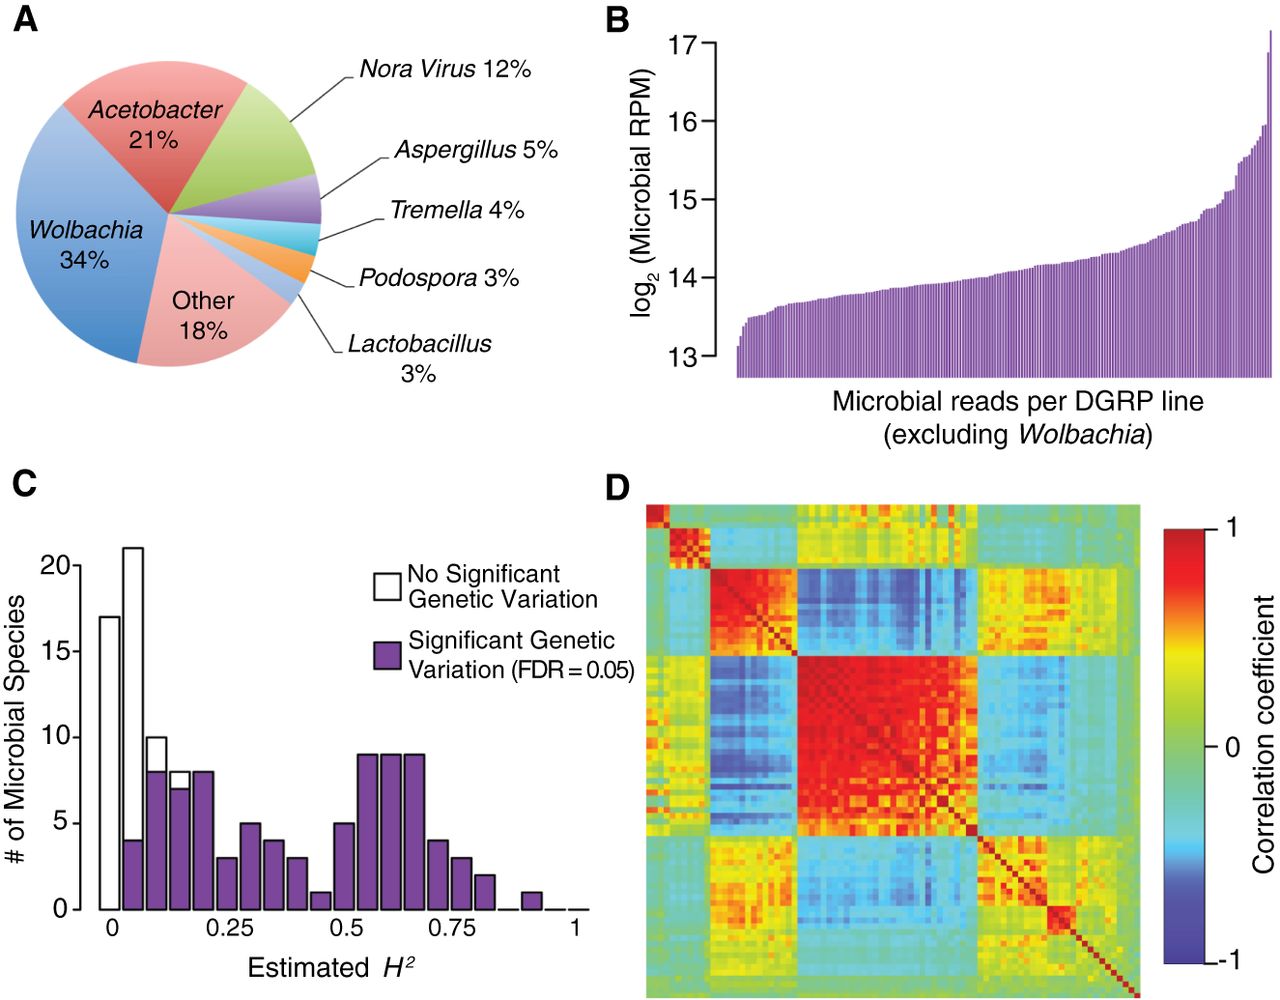
Figure 6.
Genetic variation of microbiome composition. (A) The proportion of microbiome signal in RNA-seq libraries aligned to species in each genus or viral group. (B) Line means of total microbial signal (excluding Wolbachia). (C) Distribution of H2 estimates for individual microbe species. (D) WGCNA modules for microbial species. Heatmaps are depicted as in Figure 1. Species not assigned to any module are included at the bottom right.


