
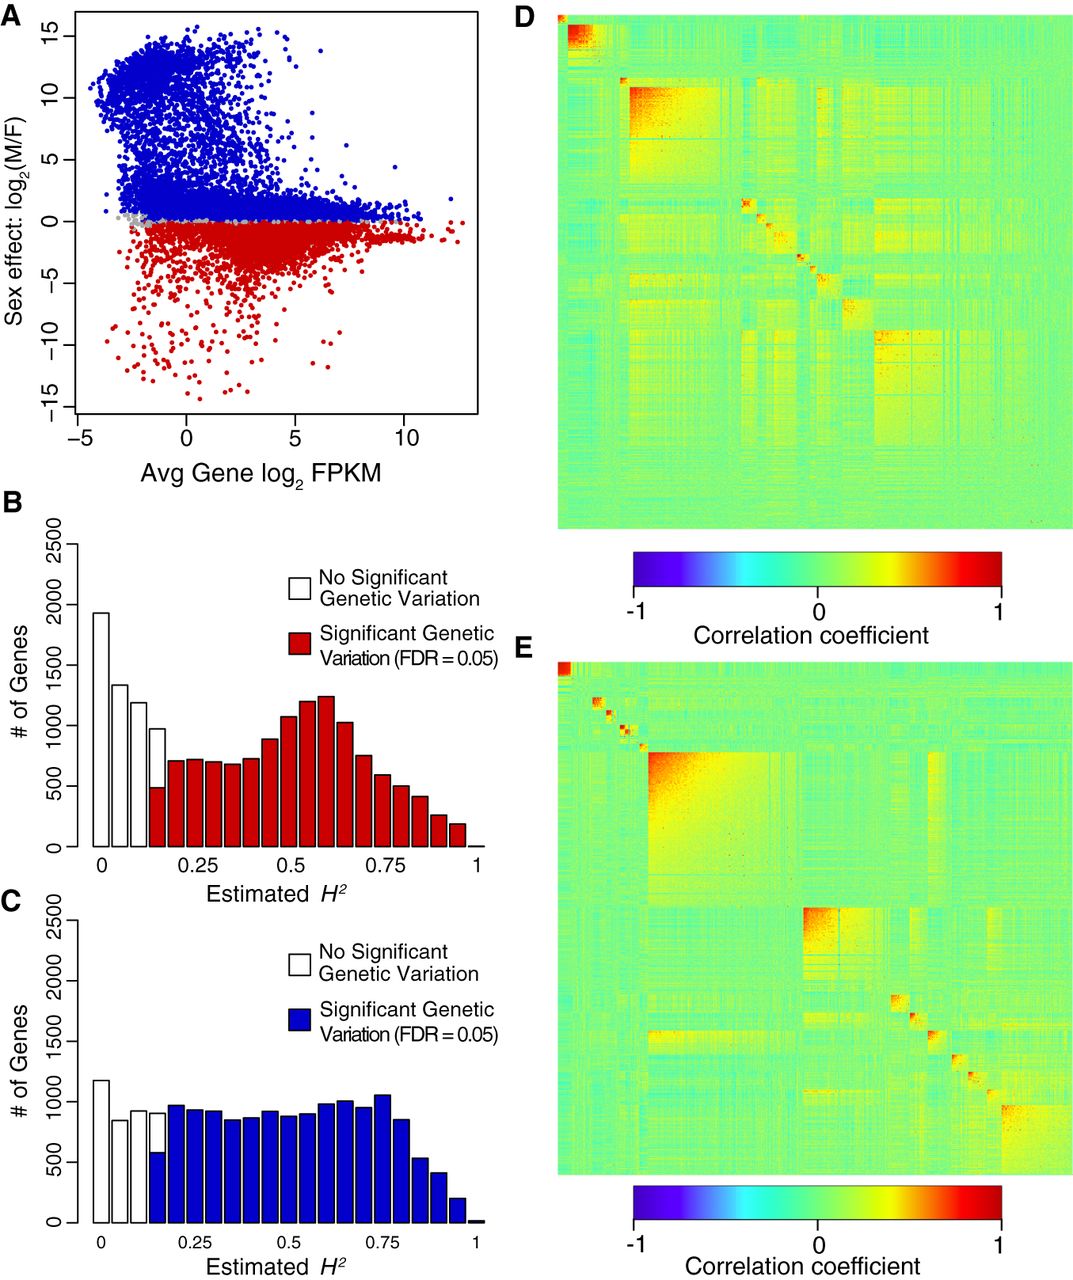
Figure 1.
Genetic variation of gene expression in the DGRP. (A) Sexual dimorphism of gene expression. Red indicates significant up-regulation in females; blue, in males. (B) Distribution of H2 estimates for annotated genes and NTRs in females. (C) Distribution of H2 estimates for annotated genes and NTRs in males. (D) WGCNA modules for annotated genes and NTRs in females. (E) WGCNA modules for annotated genes and NTRs in males. Heatmaps show the pairwise correlation of all genes in each module, sorted by average connectivity, with the most tightly connected module at the top left.


