
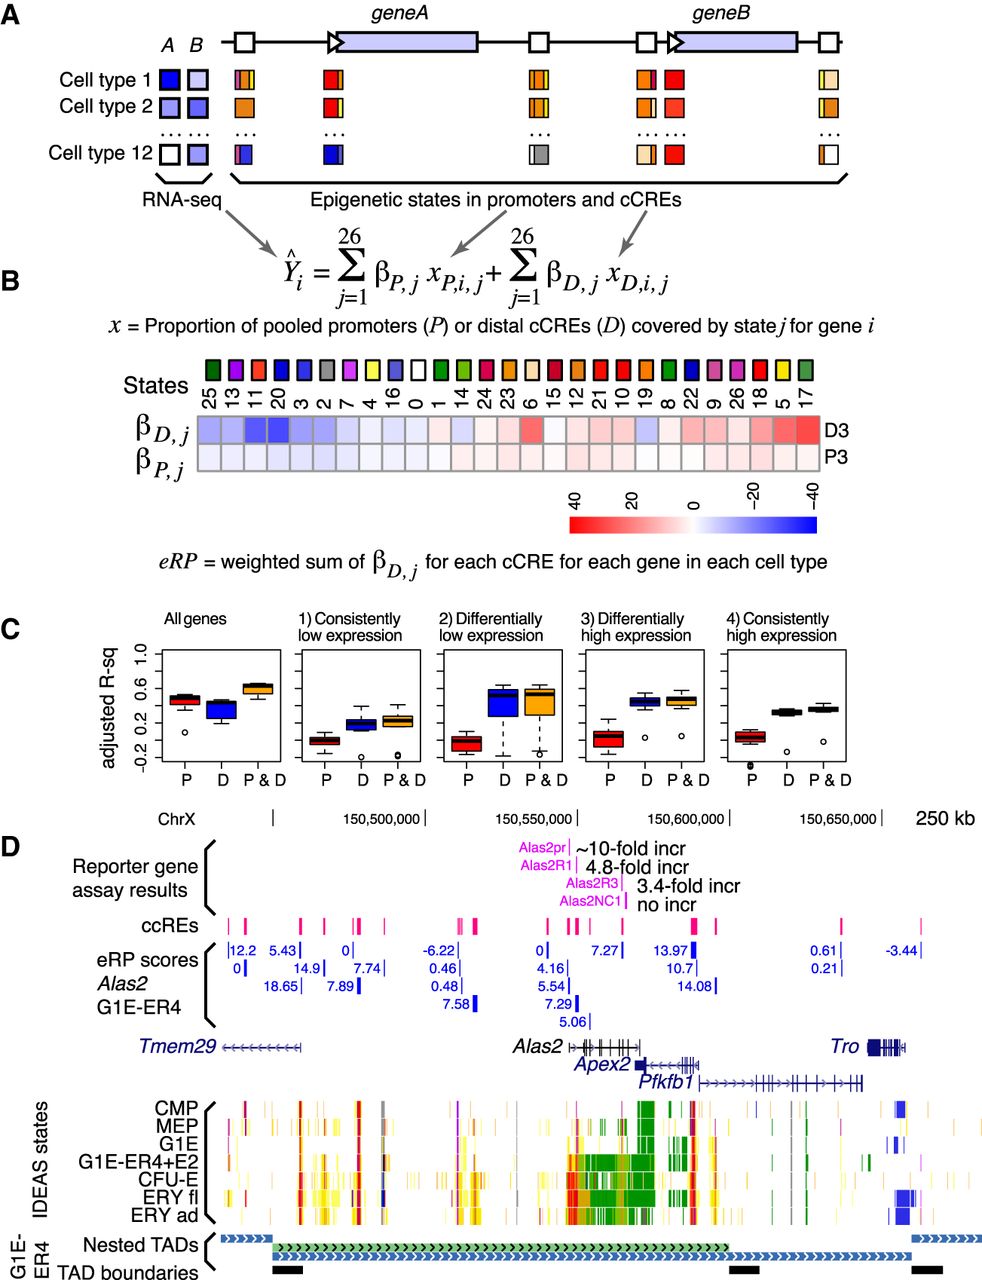
Initial estimates of regulatory output and target gene prediction using regression models of IDEAS states in promoters and cCREs versus gene expression. (A) Illustration of promoters and cCREs around two potential target genes, showing expression profiles of the genes across cell types (shades of blue; left) and promoters/cCREs with one or more epigenetic states assigned in each cell type. (B) Multivariate linear regression of proportion of promoters and pooled cCREs in each state against expression levels of potential target genes, keeping promoters and cCREs separate and learning the regression coefficients iteratively in a subselection strategy. Values of the regression coefficients’ beta for each epigenetic state for promoters and cCREs for differentially expressed genes. The values of the regression coefficients for each epigenetic state are presented as a blue-to-red heatmap. (C) Ability of eRP scores of cCREs to explain levels of expression on Chr 1–Chr 19 and Chr X in the 12 cell types for all genes and in the four categories of genes (1–4). A leave-one-out strategy was used to calculate the accuracy predicting expression. The distributions of adjusted r2 values are shown as box-plots for promoters, distal cCREs, and combined. (D) Illustration of eRP scores for cCREs in and around the Alas2 gene, including a comparison with previously measured enhancer and promoter activities. Nested TADs called by OnTAD (An et al. 2019) are shown in the bottom tracks.


