
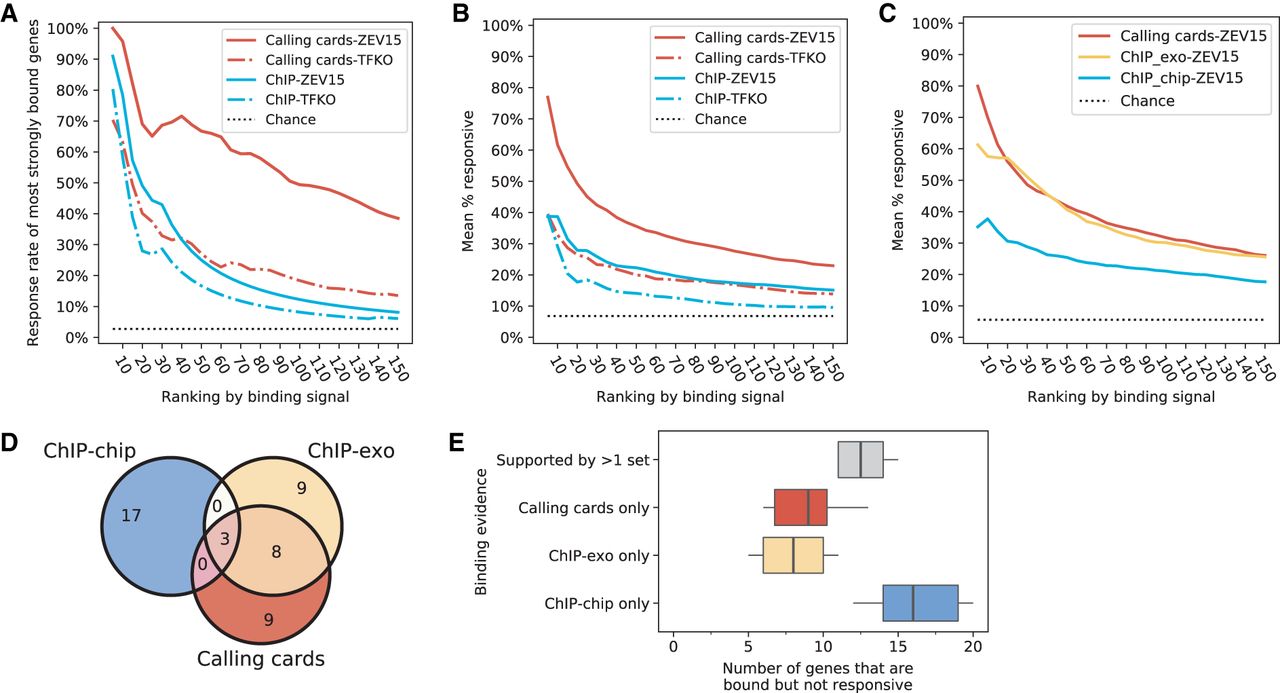
Comparison of yeast perturbation-response and binding data sets. (A) The fraction of most strongly Leu3-bound genes that are responsive to Leu3 perturbation, as a function of the number of most strongly bound genes considered. (B) Same as A, with response rates averaged across the 12 TFs for which Harbison ChIP, calling cards, TFKO, and ZEV data were available. (C) Same as B, with response rates averaged across the eight TFs for which Harbison ChIP, calling cards, ChIP-exo, and ZEV15 data were available. (D) Venn diagram for the 20 genes that are most strongly bound by Leu3 in each assay but not responsive to Leu3 perturbation (ZEV15). Only the top 20 nonresponsive genes ranked by their binding strengths are shown. (E) The analysis shown in D, applied to the eight TFs for which we have data in ChIP-chip, ChIP-exo, calling cards, and ZEV. The three colored box plots show the genes that are only bound in one of the three binding sets. The box plot in gray shows the genes with evidence in at least two binding sets.


