
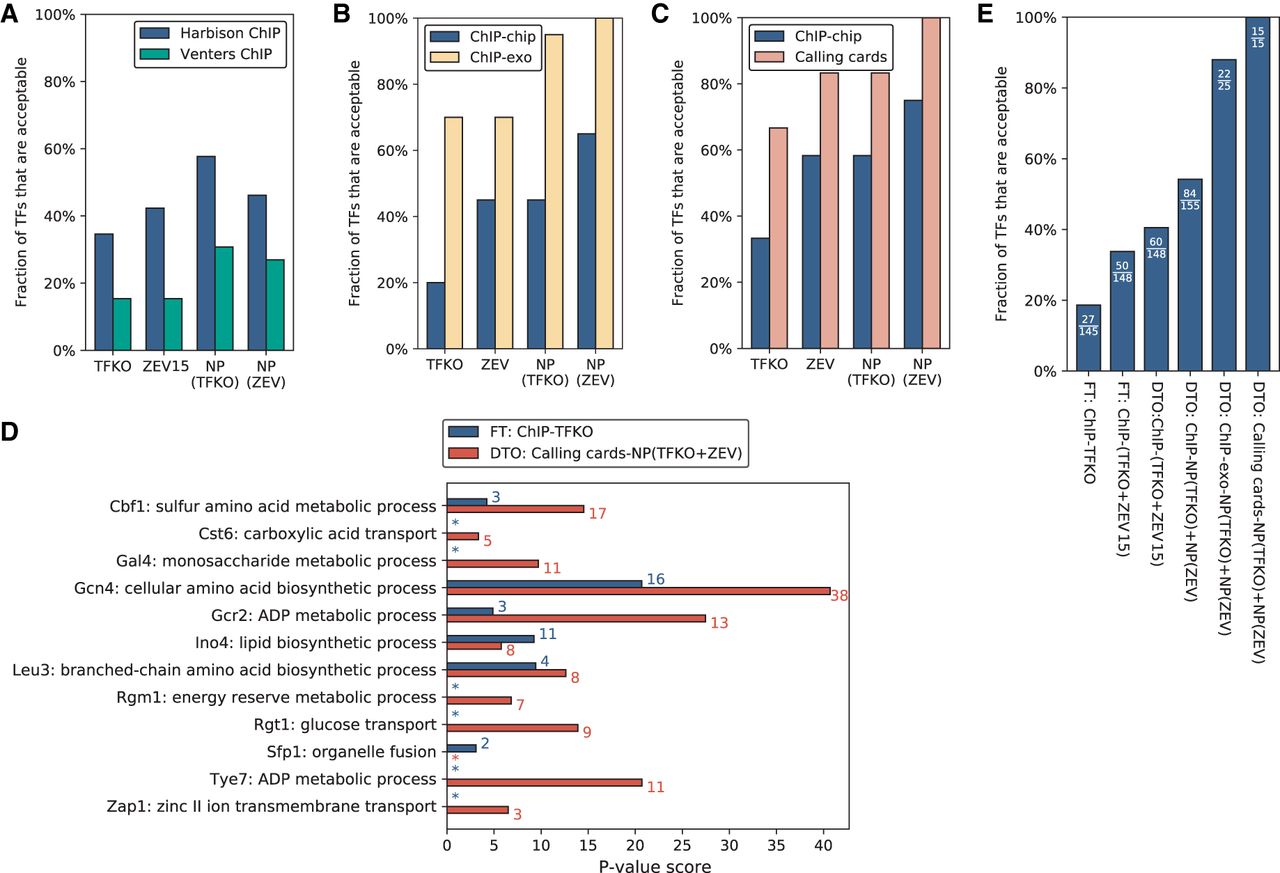
Generating a high-confidence yeast TF network. (A) Percentage of TFs showing acceptable convergence, when comparing the Harbison ChIP and Venters ChIP data on the same 26 TFs. Regardless of the perturbation data set or the processing by NetProphet 2.0, the Harbison ChIP data always yield more acceptable TFs. (B) Among the 20 TFs for which we have data in Harbison ChIP-chip, ChIP-exo, TFKO, and ZEV, the percentage that show acceptable convergence. Regardless of the perturbation data set or processing by NetProphet 2.0, ChIP-exo always yields more acceptable TFs. For both TFKO and ZEV, NetProphet postprocessing yields more acceptable TFs than raw differential expression. When NetProphet-processed ZEV data are compared to ChIP-exo data, all TFs show acceptable convergence. (C) Among the 12 TFs for which we have data in Harbison ChIP, calling cards, TFKO, and ZEV, the percentage that show acceptable convergence. When NetProphet-processed ZEV data are compared to calling cards, all TFs show acceptable convergence. (D) For each of the 12 TFs for which we have data in Harbison ChIP, calling cards, TFKO, and ZEV, the Gene Ontology (GO) term that is most strongly enriched in the TF's targets. Targets are determined either by simple intersection of the bound and responsive genes in Harbison ChIP and TFKO data, using fixed thresholds (blue) or by dual threshold optimization on calling cards data and output from NetProphet 2.0 run on the TFKO and ZEV expression data (red). The colored numbers indicate the number of target genes annotated to the most significant GO term. Asterisk indicates no GO enrichment with P < 0.01. (E) Among all TFs for which the indicated analyses can be carried out, the percentage that are acceptable in either TFKO or ZEV data or both. The fraction shows the number of acceptable TFs over the total number of TFs that could be analyzed. (FT) Fixed threshold, (DTO) dual threshold optimization.


