
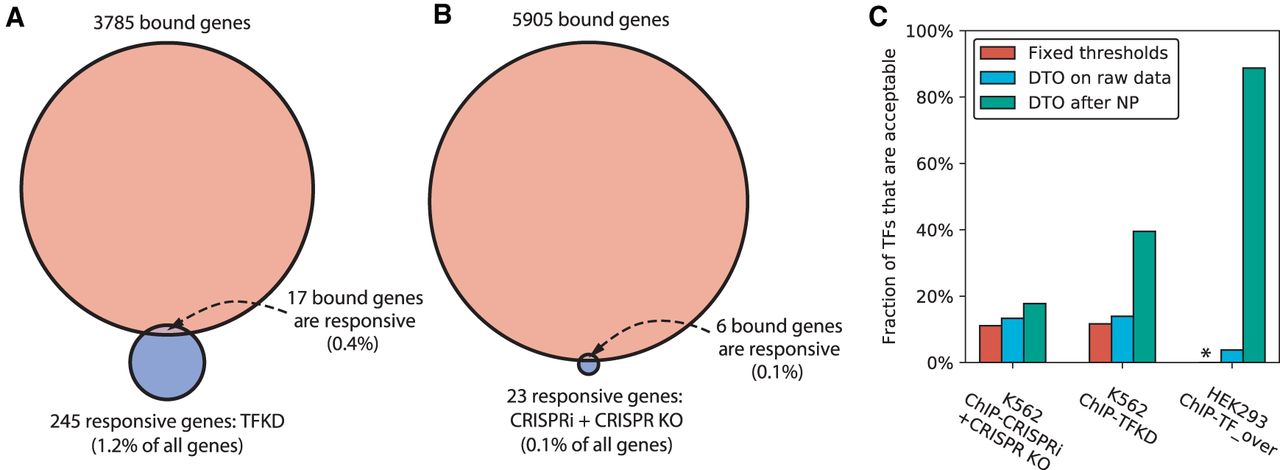
Network inference with dual threshold optimization in human cell lines. (A) Medians of number of bound genes, number of perturbation-responsive genes, and number of genes that are both bound and responsive, when comparing ENCODE K562 ChIP-seq data to ENCODE TFKD data. Excludes TFs with either no bound genes or no responsive genes. Binding threshold is P < 0.05 and response threshold is P < 0.05 with no minimum fold change. (B) Comparison of ENCODE K562 ChIP-seq data and ENCODE CRISPRi + CRISPR KO data, as in A. (C) Comparison of human networks derived from fixed thresholds, dual threshold optimization on raw perturbation-response data, and DTO on perturbation-response data processed by NetProphet 2.0. The vertical axis is the number of TFs showing acceptable convergence divided by the number that were both ChIPped and perturbed (K562: ChIP-CRISPRi + CRISPR KO = 45, K562: ChIP-TFKD = 43, HEK293: ChIP-TF_over = 80). Asterisk indicates that no fixed threshold analysis for HEK293 is available due to the lack of response P-values.


