
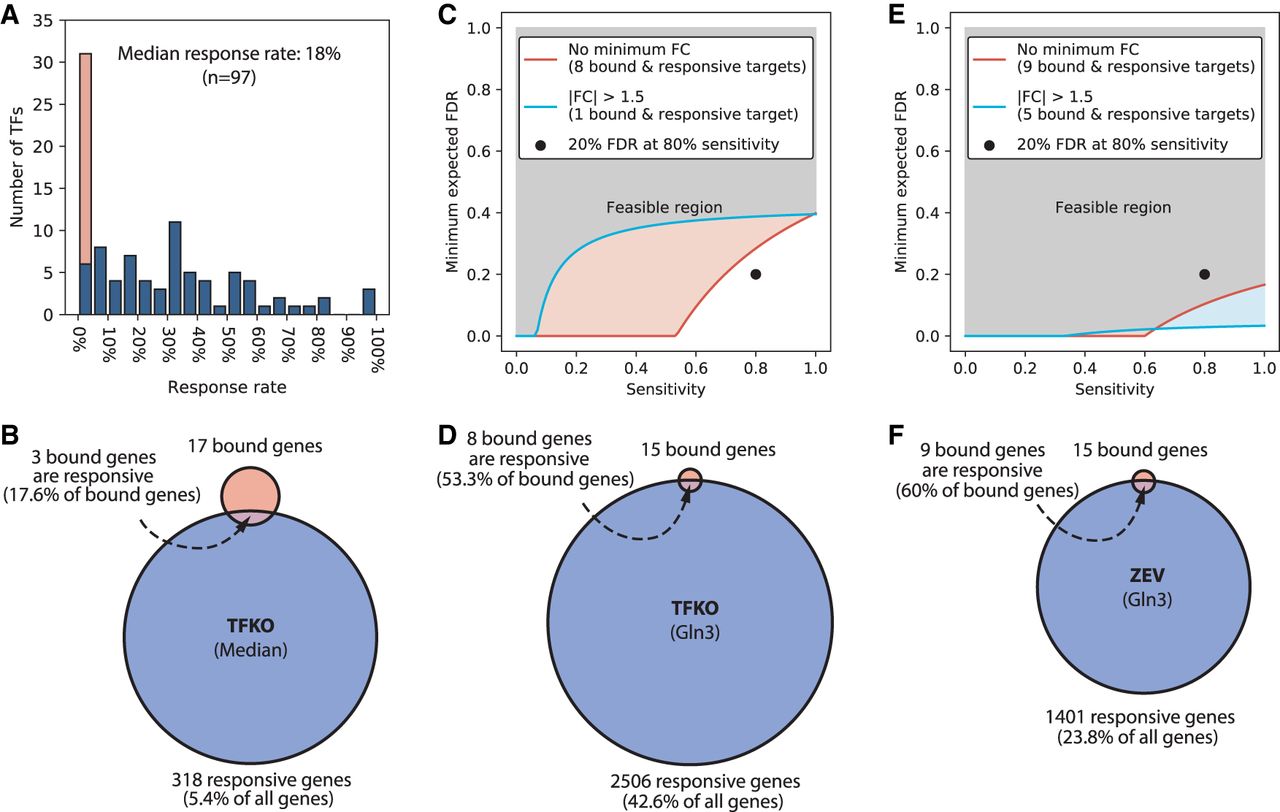
Overlap between bound and responsive gene sets. (A) Distribution of the response rates of TFs (fraction of bound genes that respond to TF perturbation) in the Harbison binding and Kemmeren TFKO data sets. Stacked orange bar indicates the number of TFs with response rates of exactly 0. Binding threshold is P < 0.001 and response threshold is P < 0.05, as recommended in the original publications, with no minimum fold change. (B) Median numbers of bound genes (17), perturbation-responsive genes (318), and intersection size (3), when comparing the ChIP-chip data to the TFKO perturbation-response data. Thresholds are as in A. (C) Minimum expected FDR as a function of sensitivity for TF Gln3, when comparing ChIP to TFKO. Genes are counted as responsive if they have adjusted P < 0.05 (blue line) or adjusted P < 0.05 and fold change >1.5 (salmon line). Eighty percent sensitivity with 20% FDR is not attainable at either threshold, when comparing ChIP to TFKO. (D) The bound set, responsive set, and intersection for Gln3, when comparing ChIP to TFKO. (E) Minimum expected FDR, as a function of sensitivity, with moderate and tight thresholds for responsiveness, when comparing ChIP to ZEV15. Eighty percent sensitivity with 20% FDR is attainable at either threshold. (F) The bound set, responsive set, and intersection for Gln3, when comparing ChIP to ZEV15.


