
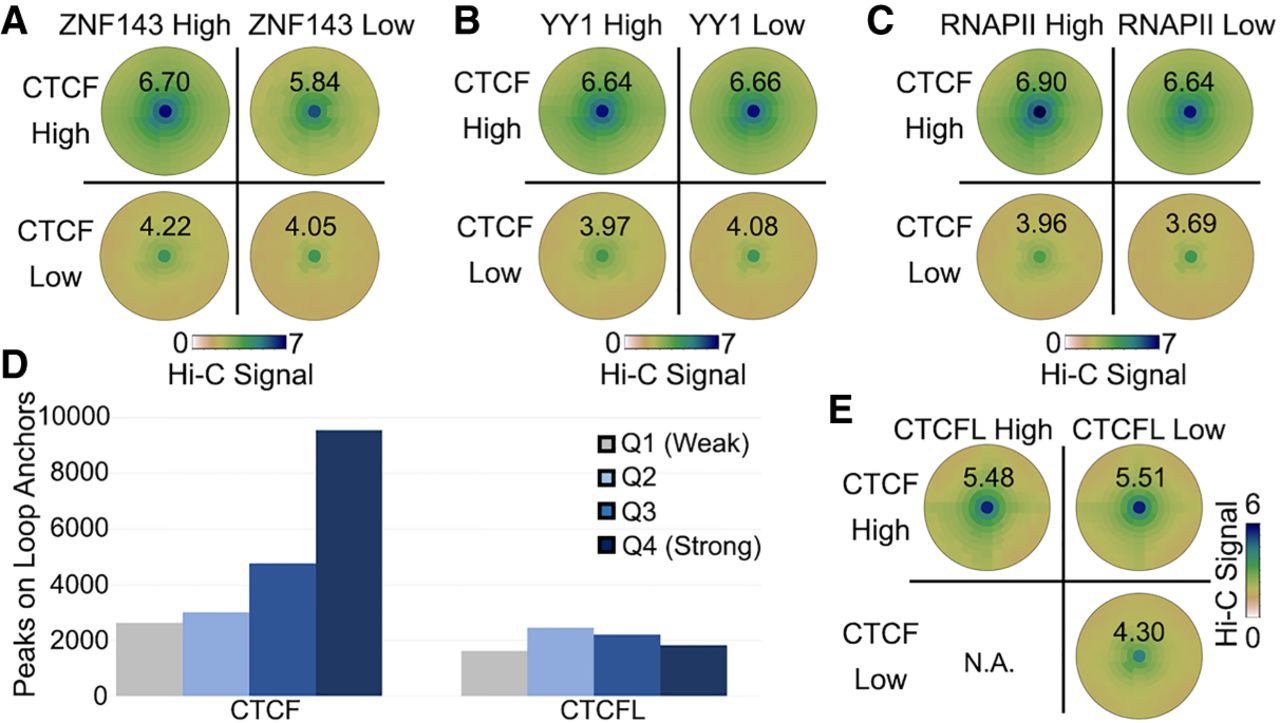
Contribution of transcription factors to CTCF loops. (A–C) SIPMeta bullseye plots for loops with either high or low CTCF ChIP-seq signal on both anchors and either high or low ZNF143 (A), YY1 (B), or RNAPII (C) ChIP-seq signal on both anchors. Scores represent average distance-normalized Hi-C signal of the loop at the center of the bullseye plot. (D) Number ChIP-seq peaks for each strength quartile that overlaps loop anchors in K562 cells. (E) SIPMeta bullseye plots for loops with either high or low CTCF and CTCFL ChIP-seq signal on both anchors. (N.A.) An insufficient number of unambiguous loops in this category. Scores represent average distance-normalized Hi-C signal of the loop at the center of the bullseye plot.


