
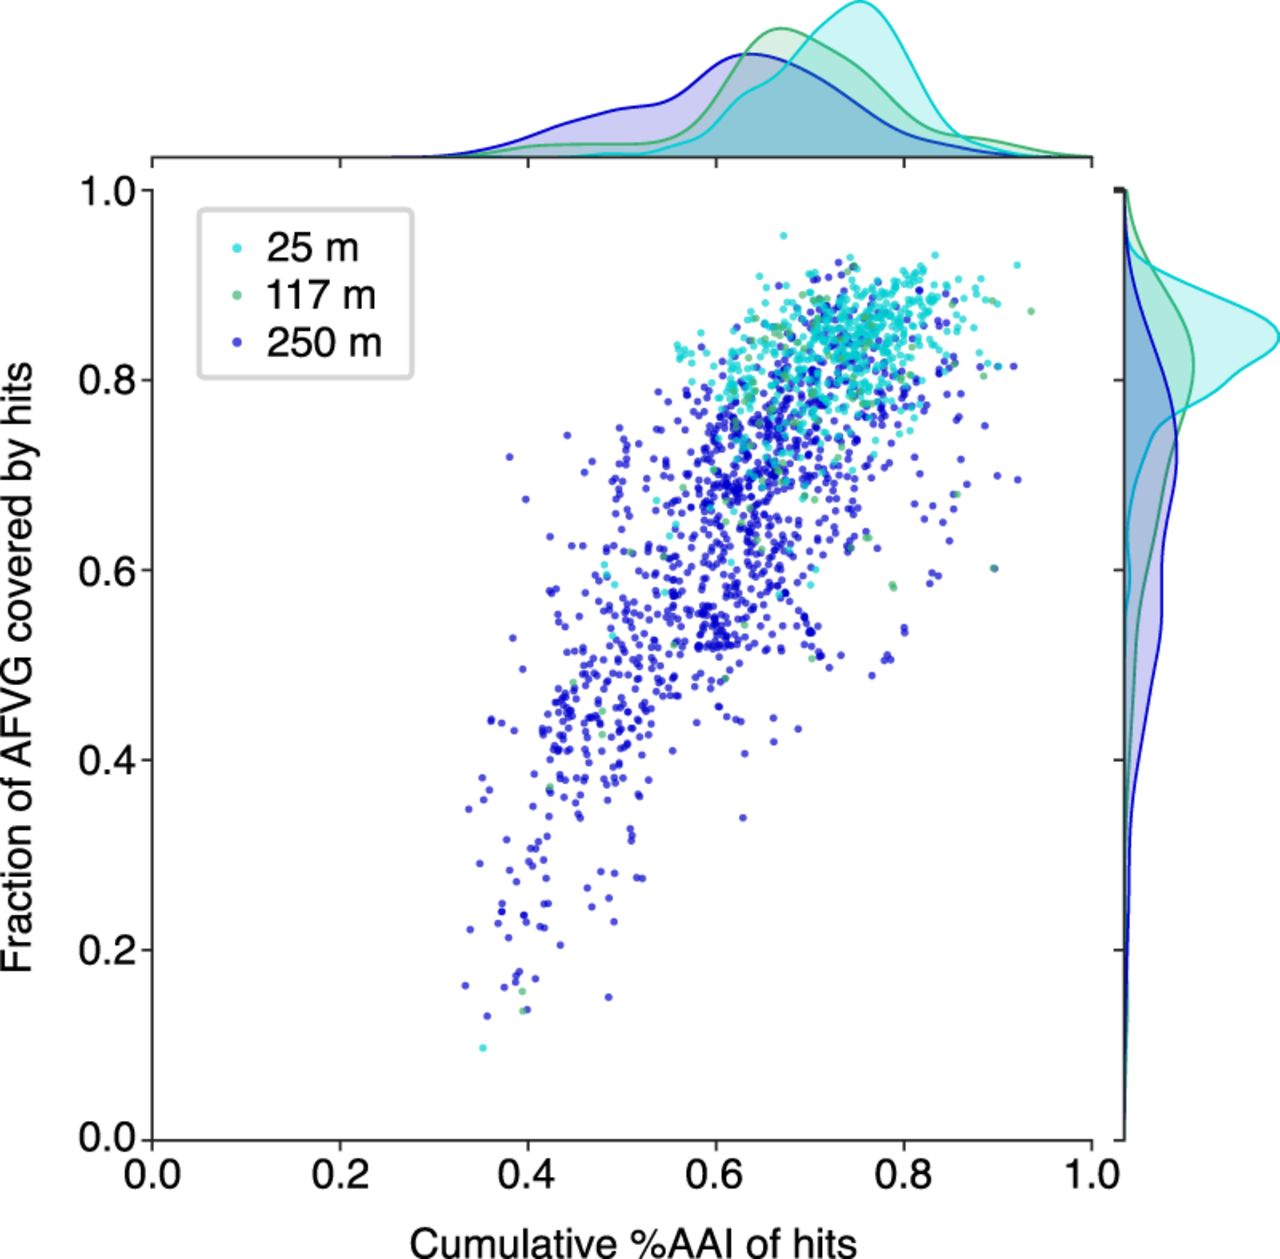
Figure 3.
Similarity of AFVG annotated genes to known viral genes. Each point represents an AFVG colored by the depth at which it was found. The y-axis encodes the fraction of genes with matches to known viral genes, and the x-axis encodes the cumulative percentage of amino acid identity (%AAI) of those matches. The marginal histograms show the distribution of values for “cumulative %AAI” (top) and “fraction of genes” (right) grouped by sample depth.


