
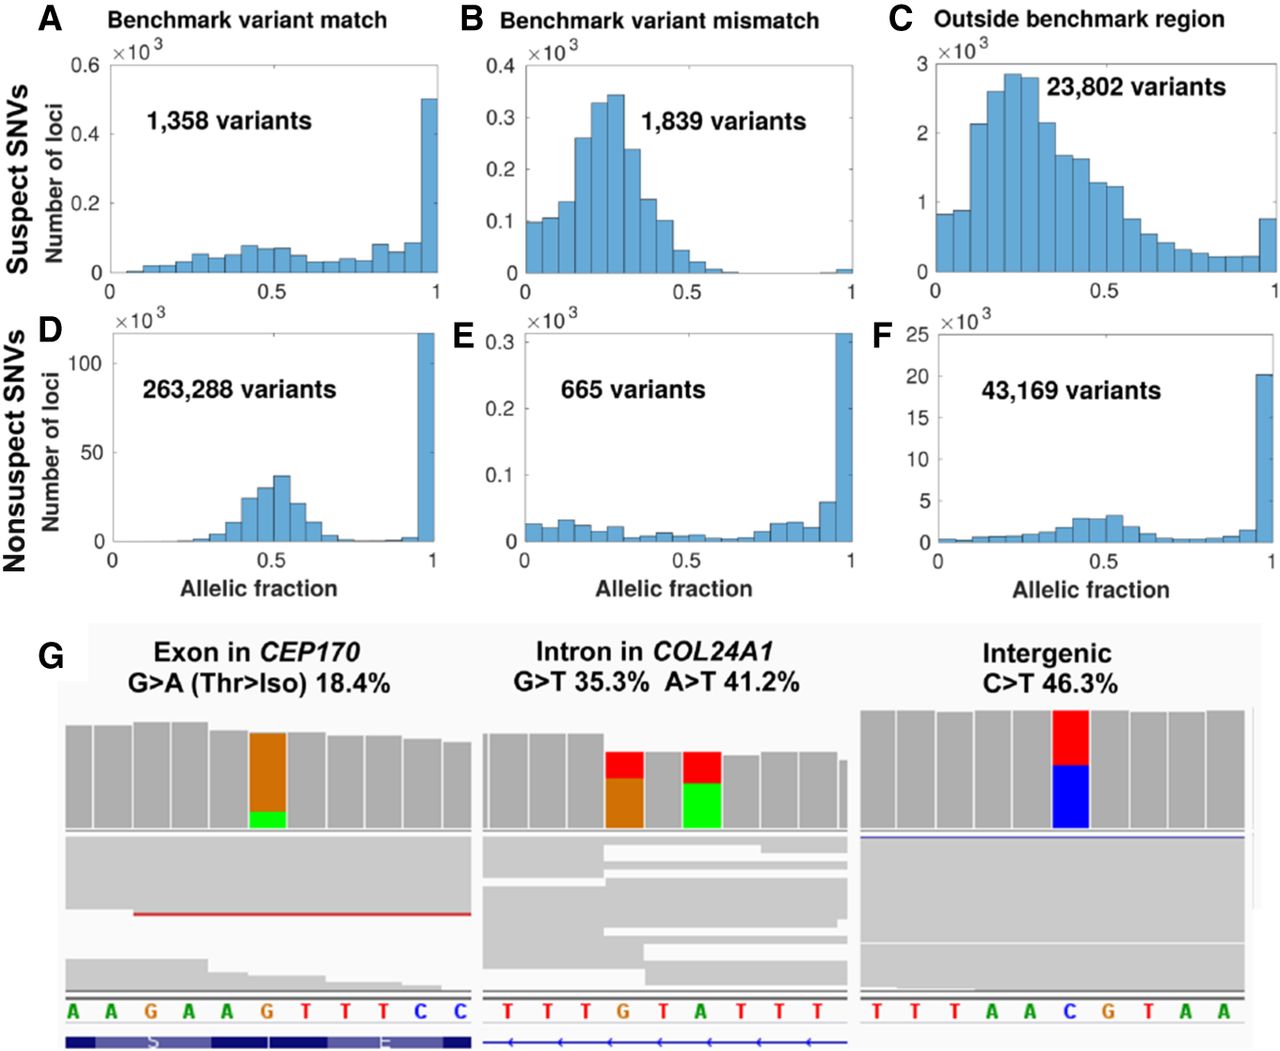
Suspect loci in detected variants of a gold-standard genome. Distribution of allelic fractions of SNVs called in Chromosome 1 of NA12878, classified as either suspect SNVs (top row in A–C) in data set 1 (Personalis), or nonsuspect SNVs (second row in D–F). SNVs were also classified based on whether they matched the NIST GIAB v3.3.2 benchmark variants (left column), did not match the benchmark variants (middle column), or were outside of the GIAB benchmark region (right column). Low coverage variants (<10 supporting reads) were excluded from this analysis. (G) Cropped panels from the Integrative Genomics Viewer (Robinson et al. 2017), highlighting suspect loci from data set 1 in Chromosome 1 that were called as variants separately in NA12878. NA12878 was sequenced with Illumina HiSeq but not used as part of the patient data set to create the IncDB (Zook et al. 2014, 2019). Reads are shown in gray with colored bands where nonreference allelic reads were observed (A = green, C = blue, G = brown, T = red). Suspect SNVs and their respective read proportions in the NA12878 cell line are indicated above; these systematically occur at similar levels across all patients in the IncDBs used to identify them. (Left, middle) Suspect SNVs in exonic and intronic regions of genes in the PanelApp intellectual disability panel (Martin et al. 2019). (Right) Suspect SNV in an intergenic region.


