
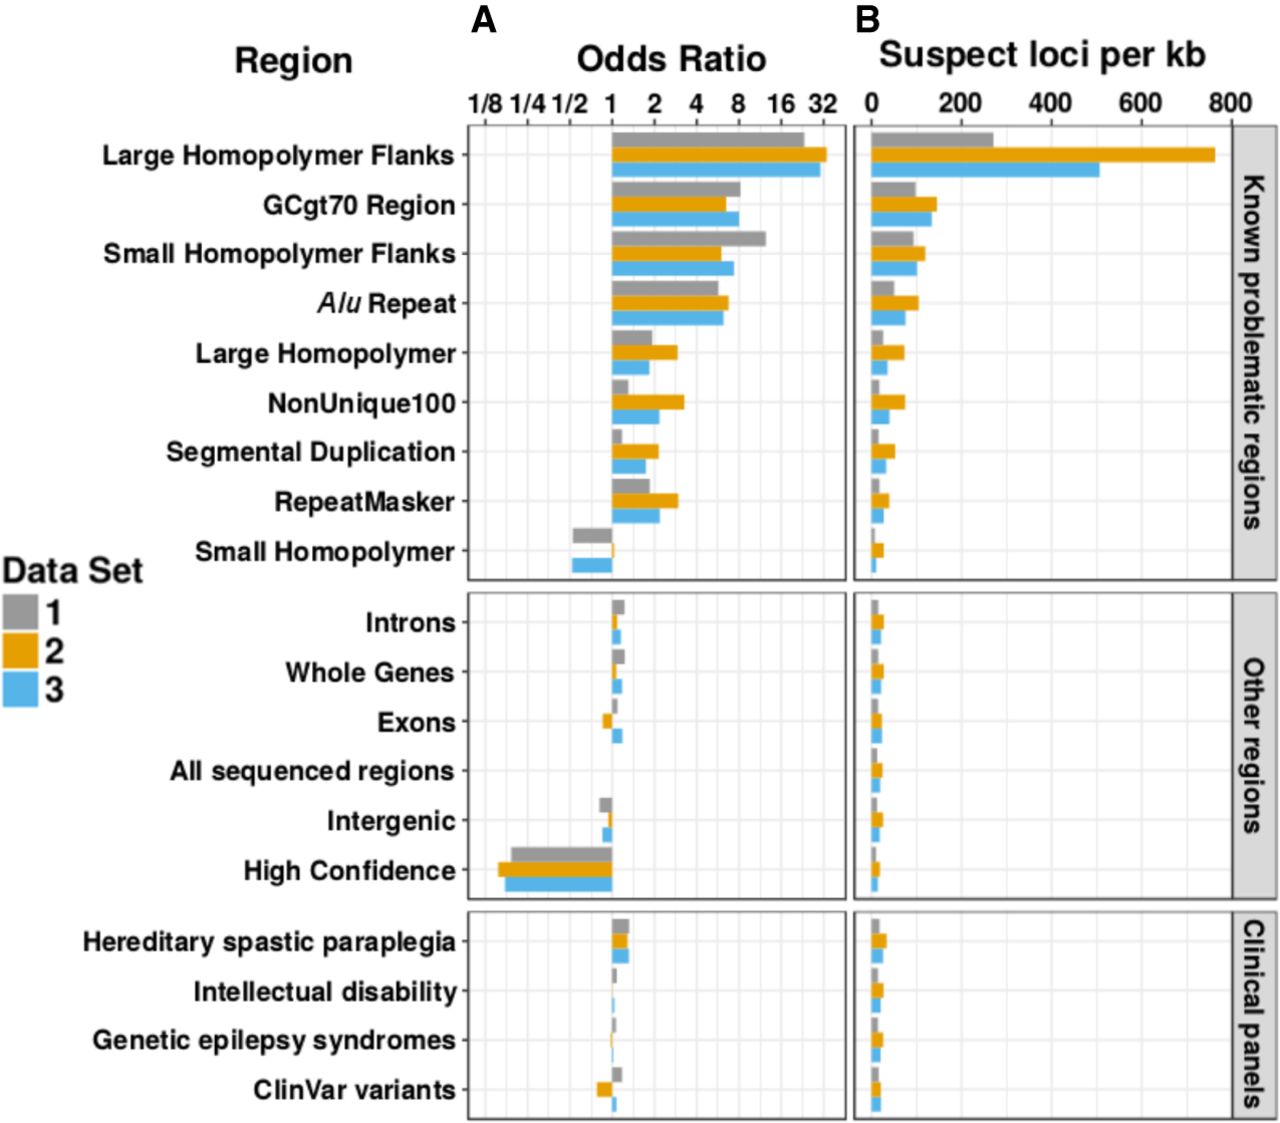
Enrichment of unique suspect loci in different types of genomic regions. All odds ratios shown are statistically significant and equivalent to the 95% upper and lower confidence intervals to three significant figures. (A) Log2 scale bar plot showing the odds ratios for regional enrichment of unique suspect loci across all autosomal chromosomes from three different data sets. All odds ratios were calculated and shown to be significant using Fisher's exact test. Regions were compared to “All sequenced regions” (odds ratio of 1). (B) Bar plot showing the number of unique suspect loci per kb across all autosomal chromosomes from three different data sets. Although clinical and high-confidence regions had a lower rate of suspect loci per kb, over the entire genome they still contained a large number of suspect loci overall in high-confidence regions (24.1/45.1/34.6 million in data sets 1, 2, and 3) and clinical regions (2.55/4.64/3.55 million in data sets 1, 2, and 3 within the intellectual disability panel alone).


