
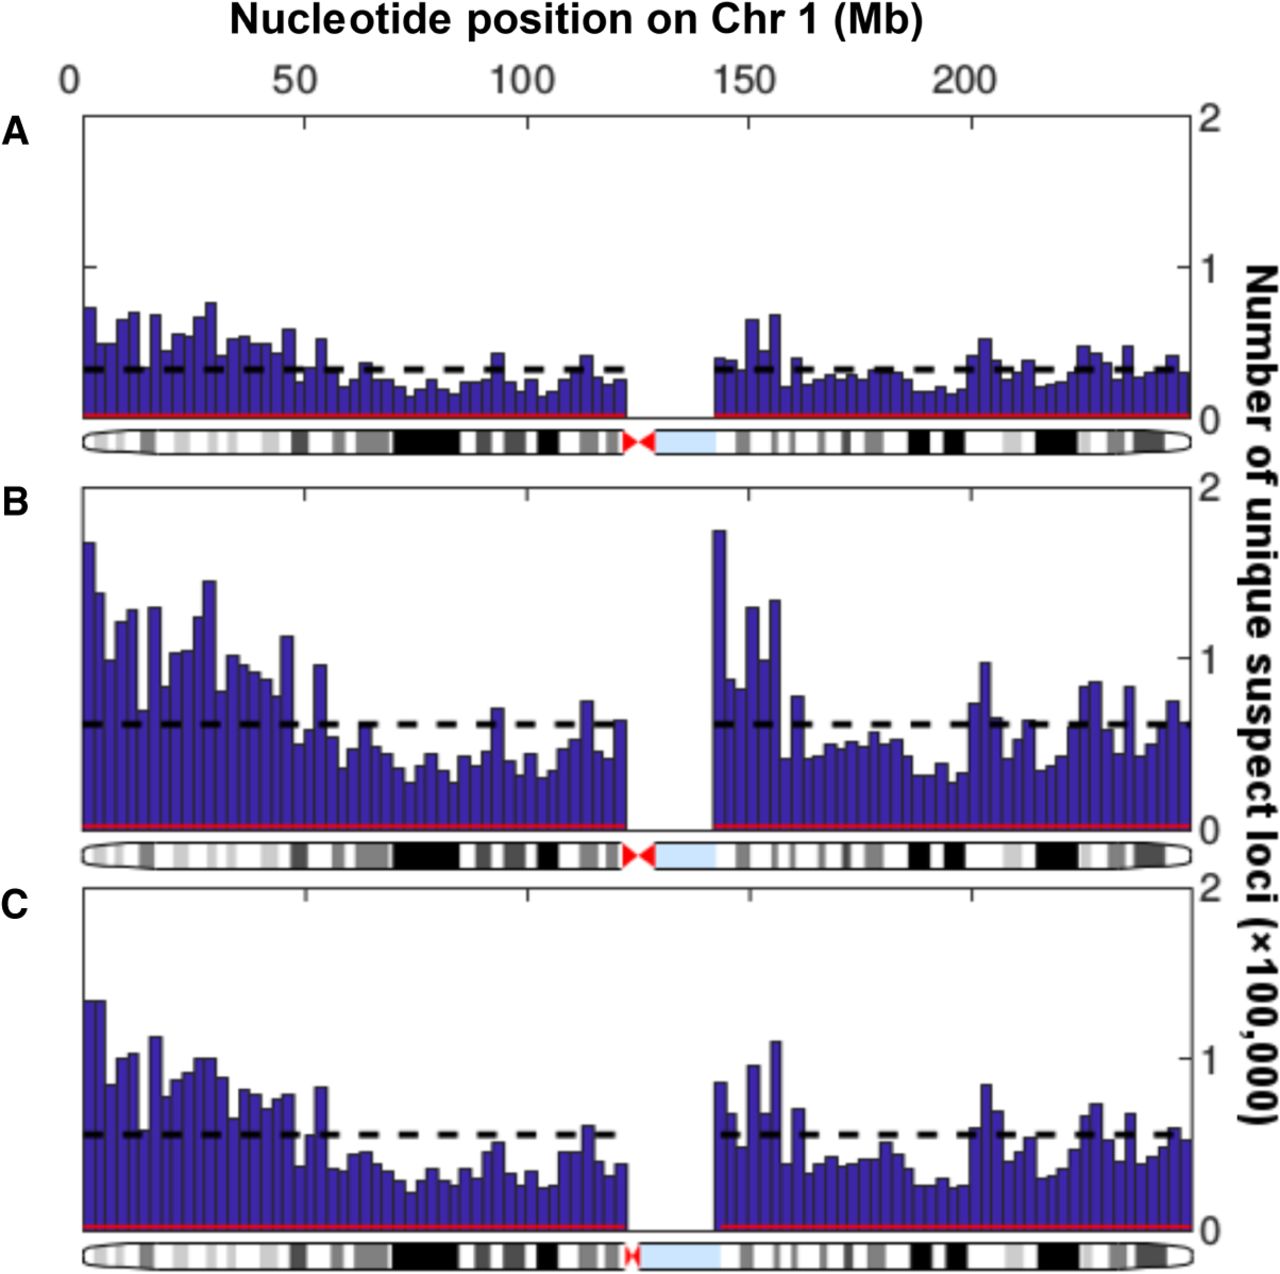
Variability in distribution of unique suspect loci in sequenced regions of Chromosome 1. Histograms show the numbers of suspect loci in 100 regular intervals across Chromosome 1, with the number of suspect loci per 2.49-million-bp bin on the y-axis and the nucleotide position on the x-axis. There were no suspect loci at the centromere since this could not be sequenced. The black dotted line shows the mean number of suspect loci per bin, while the red line shows the number of suspect loci in each bin that would be expected by chance (1 per 1000 loci). (A) Data set 1, Personalis IncDB and GRCh37. (B) Data set 2, 100,000 Genomes Project and GRCh37. (C) Data set 3, 100,000 Genomes Project and GRCh38.


