
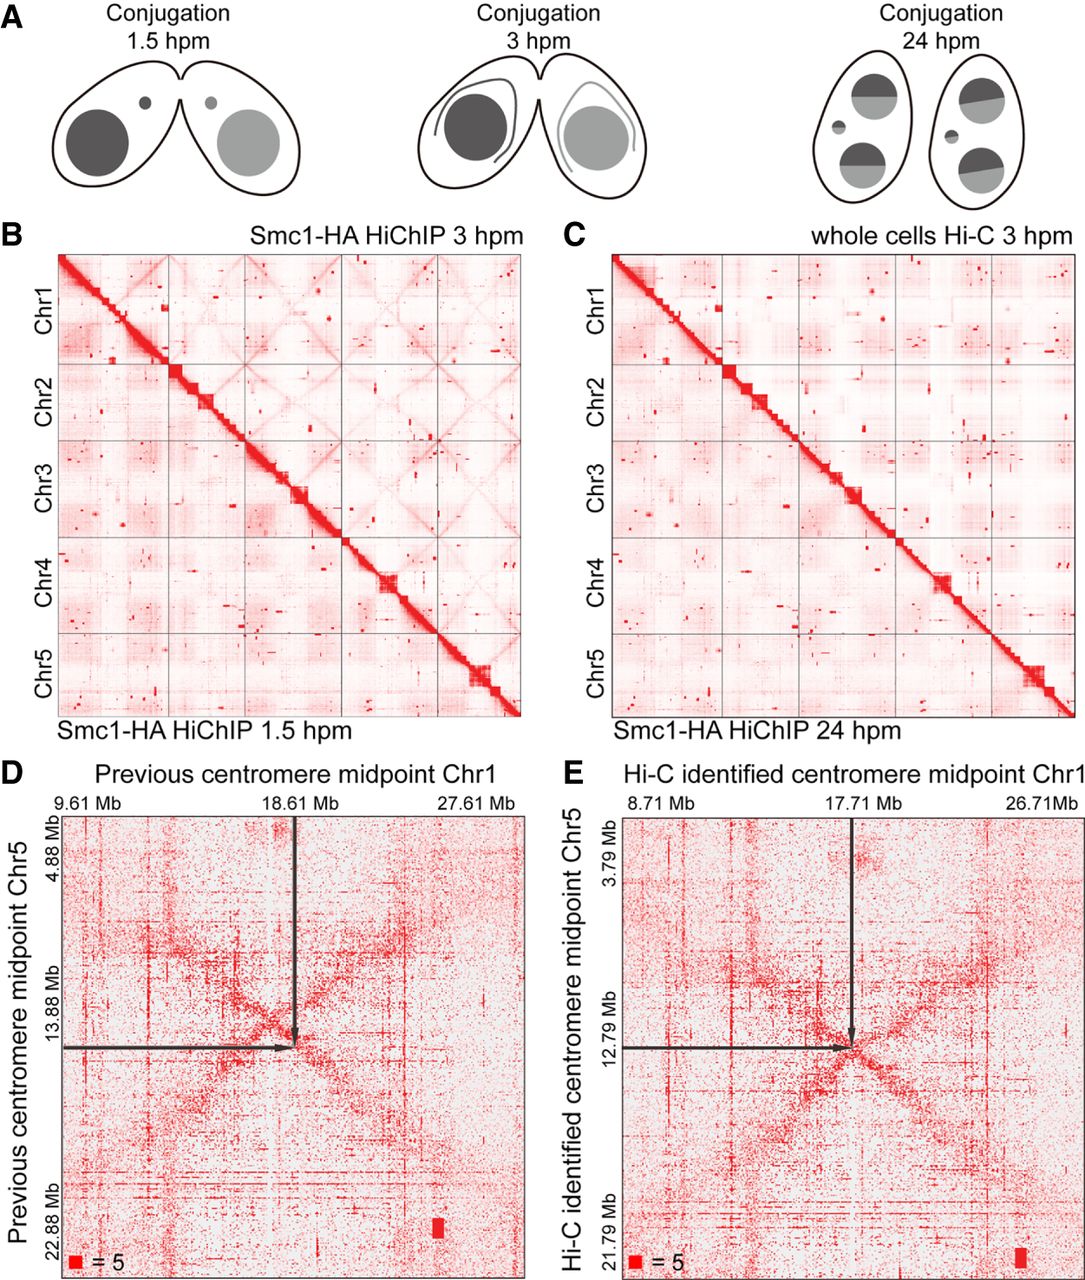
Crescent-specific interactions in the MIC of T. thermophila. (A) The schematic diagram of three different stages of T. thermophila during conjugation: 1.5 hpm, 3 hpm, and 24 hpm. (hpm) Hours post-mixing. (B) The heatmaps showing the genome-wide chromosome interactions on the MIC genome at 3 hpm (Smc1-HA HiChIP data, upper right) and 1.5 hpm (Smc1-HA HiChIP data, lower left). (C) The heatmaps showing the genome-wide chromosome interactions on the MIC genome at 3 hpm (whole cells Hi-C data, upper right) and 24 hpm (Smc1-HA HiChIP data, lower left). (D,E) The heatmaps showing the MIC inter-chromosome interactions between Chromosomes 1 and 5 at 3 hpm, either defined by a previous method (D) or by our Hi-C data (E). The black arrows on the heatmaps pointed to the midpoints of centromeres. Numbers at the lower left of heatmaps corresponded to the maximum signal in the matrix.


