
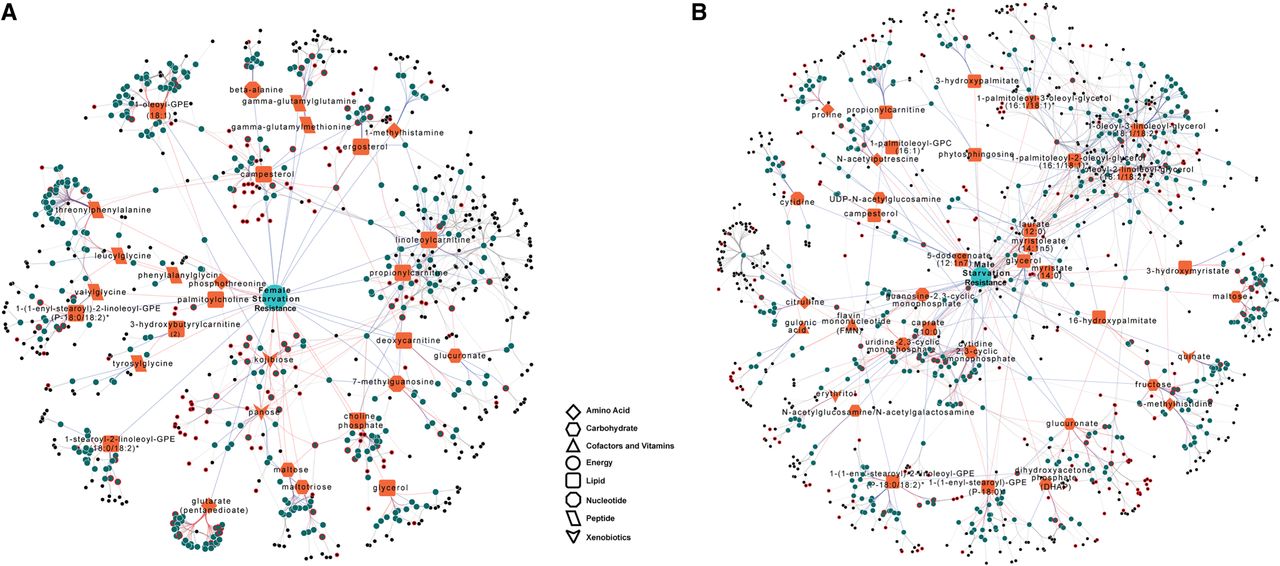
Integrated networks that incorporate polymorphic markers, variation in candidate gene expression, and variation in metabolite abundances associated with variation in starvation resistance for females (A) and males (B). Orange nodes indicate metabolites correlated with starvation resistance and teal nodes indicate candidate genes correlated with these metabolites. Black nodes indicate mQTL associated with candidate genes. Nodes with red borders indicate a direct association with the organismal phenotype. The different shapes of the orange nodes indicate different metabolic super pathways. Red edges indicate positive correlations, while blue edges represent negative correlations. Black edges connect polymorphic markers with their associated genes. The polymorphic markers, candidate genes, and metabolites presented in the figure are listed in Supplemental Table S12.


