
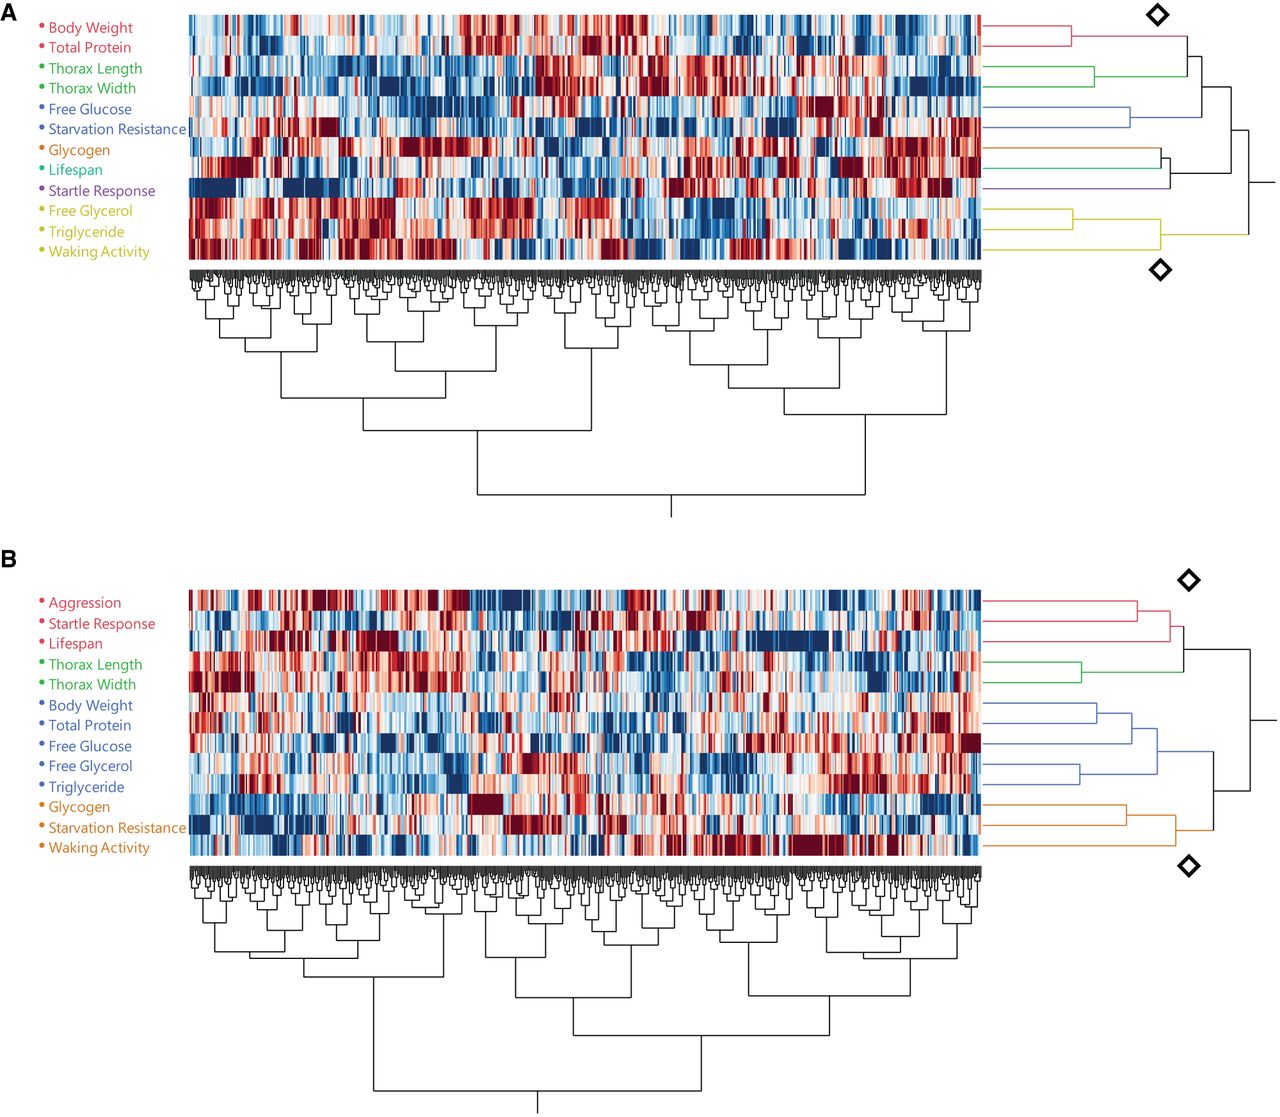
Figure 7.
Hierarchical clustering analysis of different traits based on common correlated metabolites and module PCs for females (A) and males (B). The diamond symbols indicate distances chosen to determine the appropriate number of clusters.


