
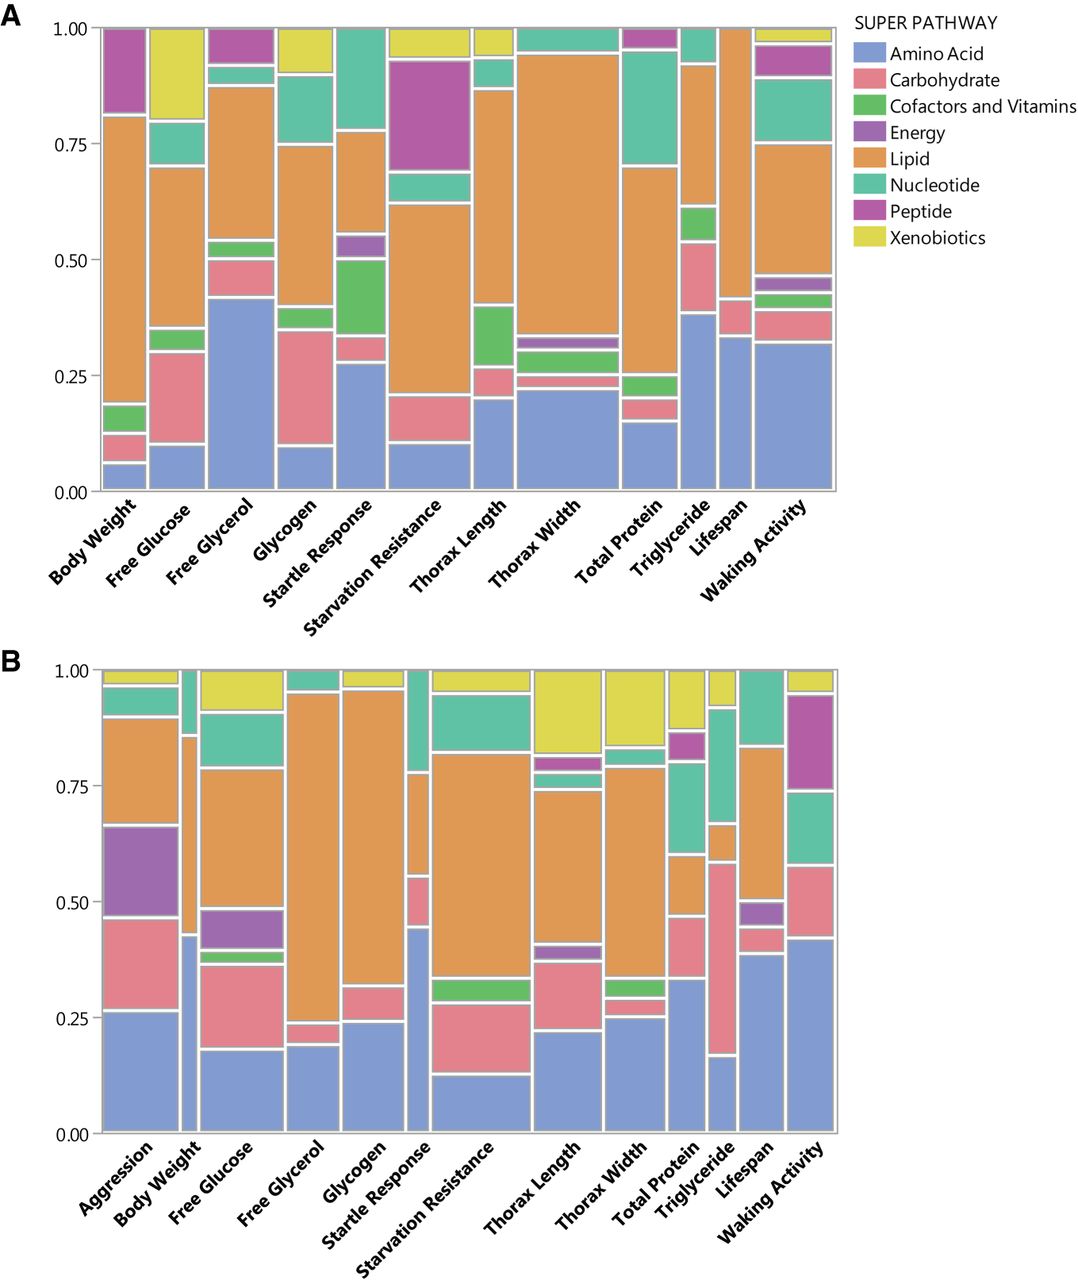
Figure 6.
Distribution of metabolic super pathways with metabolites correlated with variation in organismal phenotypes in females (A) and males (B). The widths of the columns indicate the relative numbers of metabolites correlated with variation of the traits.


