
Figure 11.
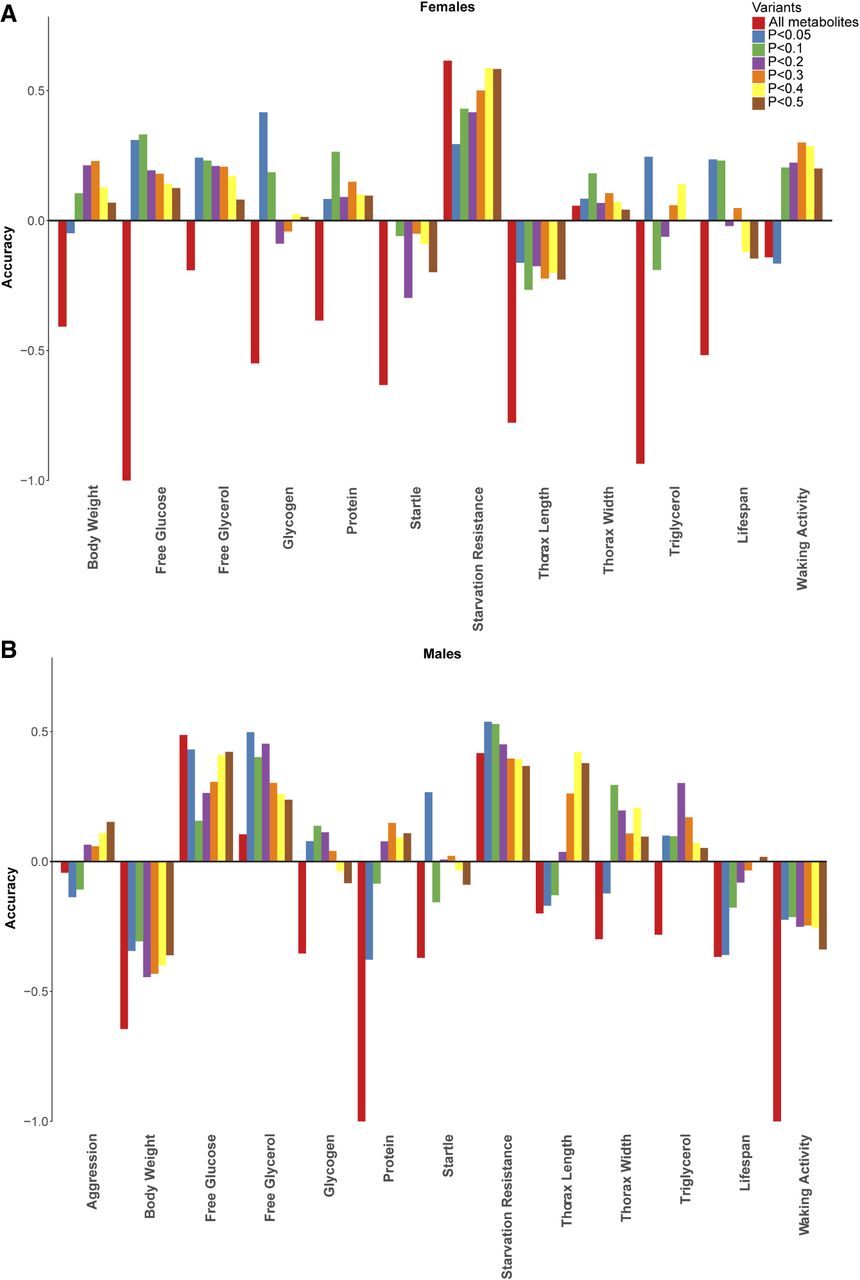
Comparisons of prediction accuracy using all variable metabolites or metabolites enriched for association with particular traits at P-values of 0.05, 0.1, 0.2, 0.3, 0.4, and 0.5, for females (A) and males (B).
(Downloading may take up to 30 seconds. If the slide opens in your browser, select File -> Save As to save it.)
Click on image to view larger version.
Comparisons of prediction accuracy using all variable metabolites or metabolites enriched for association with particular traits at P-values of 0.05, 0.1, 0.2, 0.3, 0.4, and 0.5, for females (A) and males (B).
 CiteULike
 Delicious
 Digg
Digg Facebook
 Google+
 Reddit
 Twitter
