
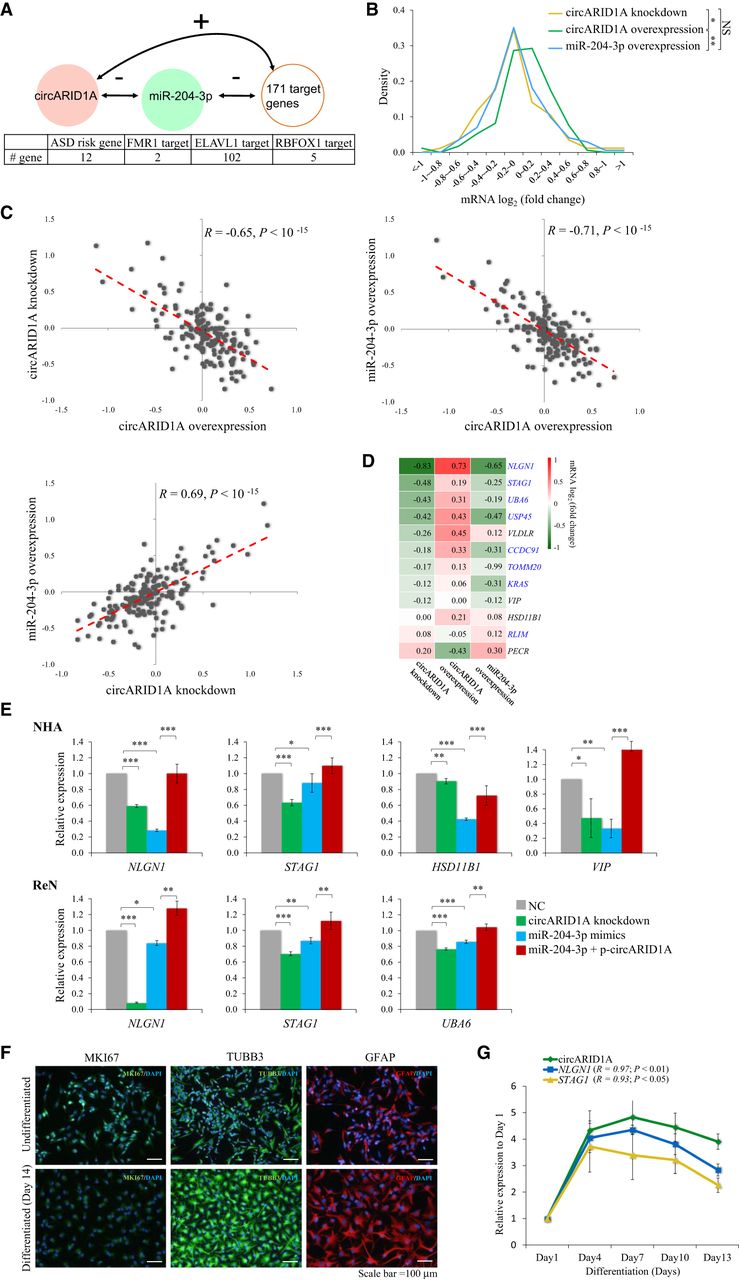
Experimental validation of the circARID1A regulatory role of miR-204-3p sponges and the corresponding circRNA-miRNA-mRNA regulatory interactions. (A) Schematic diagram representing the circARID1A-miR-204-3p regulatory axis and its corresponding targets (171 genes, including 12 ASD risk genes, two FMR1 targets, 102 ELAVL1 targets, and five RBFOX1 targets). (B–D) Microarray analysis of the target mRNA log2(fold change) in response to circARID1A knockdown, circARID1A overexpression, and miR-204-3p overexpression, respectively. (B) Distribution of the target mRNA log2(fold change) in response to circARID1A knockdown, circARID1A overexpression, and miR-204-3p overexpression. P-values are determined using one-tailed (circARID1A knockdown vs. circARID1A overexpression and circARID1A overexpression vs. miR-204-3p overexpression) or two-tailed (circARID1A knockdown vs. miR-204-3p overexpression) t-test. Significance: (*) P-value < 0.05; (**) P-value < 0.01; (NS) not significant. (C) The correlations between mRNA fold changes after circARID1A knockdown, circARID1A overexpression, and miR-204-3p overexpression. The Pearson correlation coefficient (R) and P-value are shown. (D) Heat map of the 12 ASD risk mRNA log2(fold change) in response to circARID1A knockdown, circARID1A overexpression, and miR-204-3p overexpression, respectively. The gene symbols highlighted in blue represent that the genes are also ELAVL1 targets. (E) qRT-PCR analyses of ASD risk gene expression in NHAs (top) and hNPCs (ReN cells) (bottom) after circARID1A knockdown, miR-204-3p mimics, and miR-204-3p mimics with circARID1A expression vector (p-circARID1A), respectively. (NC) Negative control. P-values are determined using two-tailed t-test. Significance: (*) P-value < 0.05; (**) P-value < 0.01; (***) P-value < 0.001. (F) Imaging of immunostained ReN cells after 2 wk of differentiation. Immunostaining shows undifferentiated (top) and differentiated (bottom) ReN cells with the cell proliferation marker MKI67 (left), the neuronal marker TUBB3 (middle), and the mature glial cell marker GFAP (right). Nuclei are stained with DAPI (blue). (Scale bar) 100 μm; (GFAP) glial fibrillary acidic protein. (G) Relative expression of circARID1A and two ASD risk genes (NLGN1 and STAG1) during hNPC differentiation. The Pearson correlation coefficients (R) between the expression of circARID1A and the two ASD risk genes and P-values are shown in parentheses. All the qRT-PCR data are the means ±SD of three experiments.


