
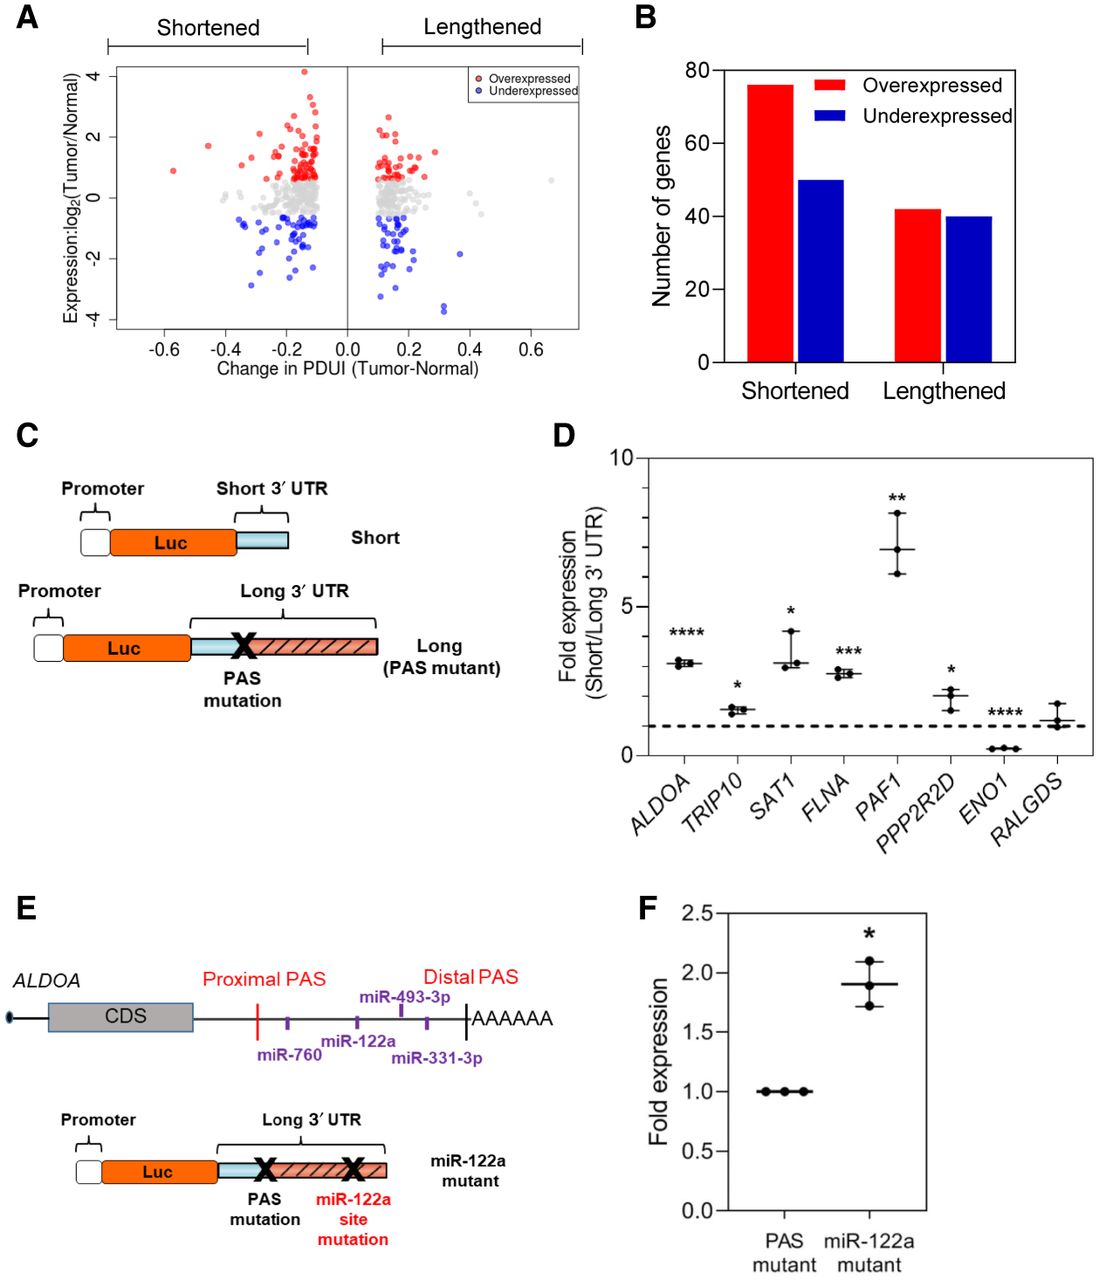
APA drives altered protein expression in PDAC. (A) Log fold change in gene expression is plotted against ΔPDUI for 3′-UTR-altered genes. Overexpressed genes (red dots) and underexpressed genes (blue dots) on the left represent 3′-UTR-shortened hits, whereas those to the right represent 3′-UTR-lengthened hits. (B) Quantification of 3′-UTR-altered genes that are overexpressed (red) or underexpressed (blue) in PDAC tumors. (C) Schematic illustrating the luciferase reporter constructs. (D) Normalized fold expression change of the luciferase reporter (short 3′ UTRs/long 3′ UTRs) for the selected list of 3′-UTR-altered genes (n = 3). The long 3′-UTR expression for each gene is normalized to 1. Each whisker plot denotes the median as the centerline and the minimum and maximum values as the whiskers: (*) P < 0.05; (**) P < 0.01; (***) P < 0.005; (****) P < 0.001. (E) Schematic showing the ALDOA 3′ UTR with positions of conserved miRNA sites as well as the miRNA mutant construct used. (F) Fold expression change of miRNA mutant construct compared to the PAS mutant in luciferase assays (n = 3). The PAS mutant expression is normalized to 1.


