
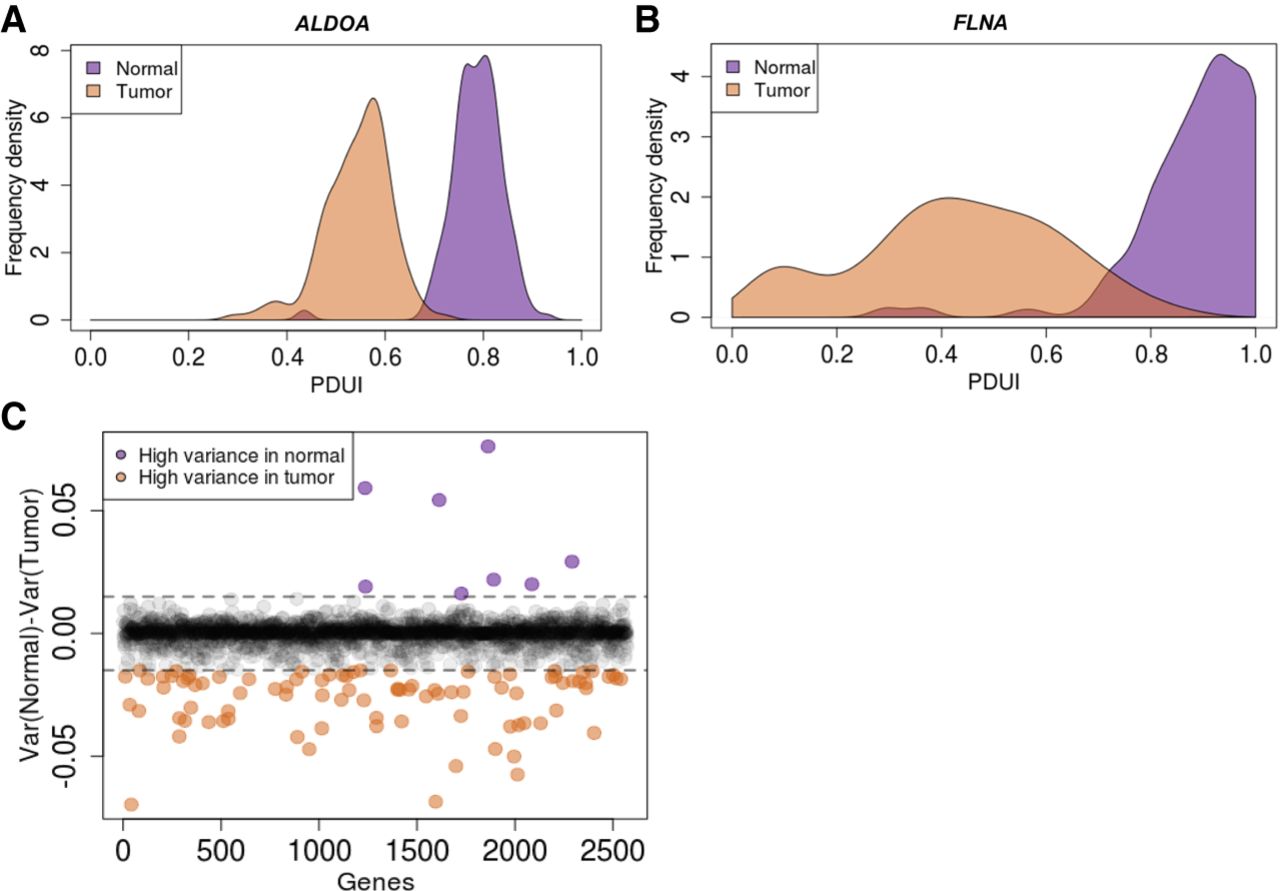
PDAC patients show substantial heterogeneity in the extent of proximal PAS usage of metabolic genes. (A) Example of a 3′-UTR-shortened gene (ALDOA) that has a tight distribution of its proximal PAS usage in normal pancreas (purple) as well as PDAC patients (orange). (B) A 3′-UTR-shortened gene (FLNA) that has a tight distribution in normal pancreas (purple); however, the extent of proximal PAS usage varies greatly across PDAC patients (orange). (C) Plot of variance in PDUI for all genes between tumor and normal. Purple dots represent genes with high variance in normal samples, and orange dots represent genes with high variance in tumor samples. Dashed lines represent 0.015 and −0.015 cutoffs.


