
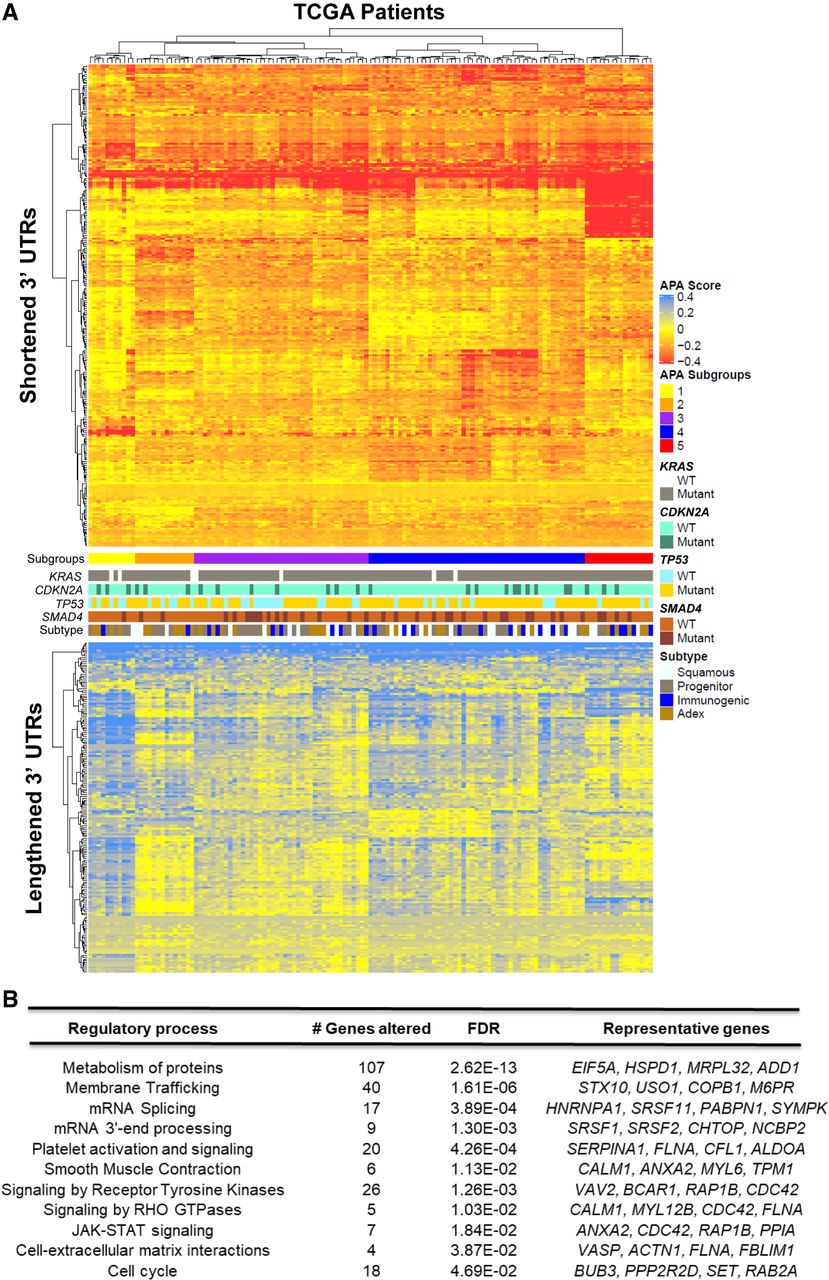
Figure 2.
3′-UTR changes are widespread among PDAC patients and enriched in PDAC pathways. (A) The heatmap shows genes (rows) undergoing 3′-UTR shortening (red) or lengthening (blue) in each patient tumor (columns) compared to median score in normal pancreas for that gene. The profile of KRAS, CDKN2A, TP53, and SMAD4 mutations as well as tumor subtype is shown in the context of distinct APA-derived patient subgroups. (B) Significantly enriched (FDR < 0.05) reactome pathways associated with 3′-UTR-altered genes.


