
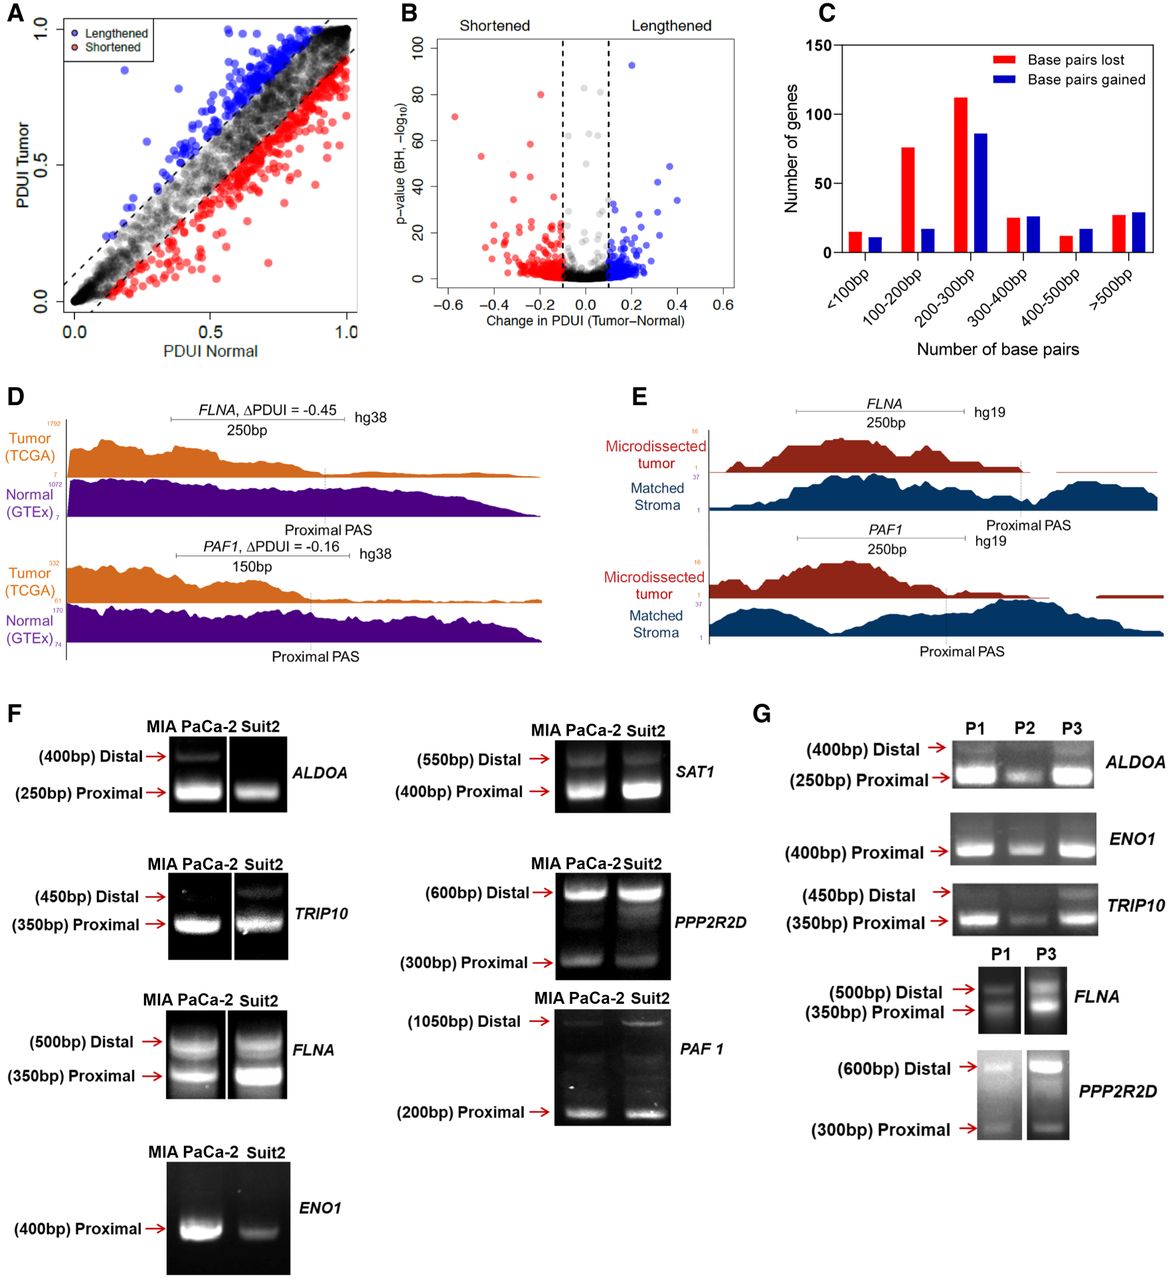
Integrative analysis of RNA-seq data identifies 3′-UTR alterations associated with PDAC. (A) A plot of PDUI score of each gene in human tumor and normal samples. Dashed lines represent 0.1 cutoffs. Blue dots represent 3′-UTR-lengthened genes, and red dots represent 3′-UTR-shortened genes. (B) A volcano plot denoting 3′-UTR-shortened (red) and -lengthened (blue) gene hits (FDR < 0.01) whose |ΔPDUI| > 0.1. (C) A plot showing the number of base pairs lost/gained by 3′-UTR-altered genes. (D) UCSC Genome Browser plot depicting the 3′-UTR RNA-seq density profile of two 3′-UTR-shortened genes (FLNA and PAF1) to highlight the coverage differences between tumor (orange) and normal (purple) patient samples. (E) UCSC Genome Browser plot highlighting the 3′-UTR profile differences between FLNA and PAF1 in a microdissected data set in patient tumor (red) and stroma (blue). (F) 3′ RACE of altered PDAC-associated genes in MIA PaCa-2 and Suit2 cells (representative images, n = 3). Approximate length of the 3′-UTR form is denoted beside each band. (G) 3′ RACE of select genes in primary patient samples (P1, P2, P3).


