
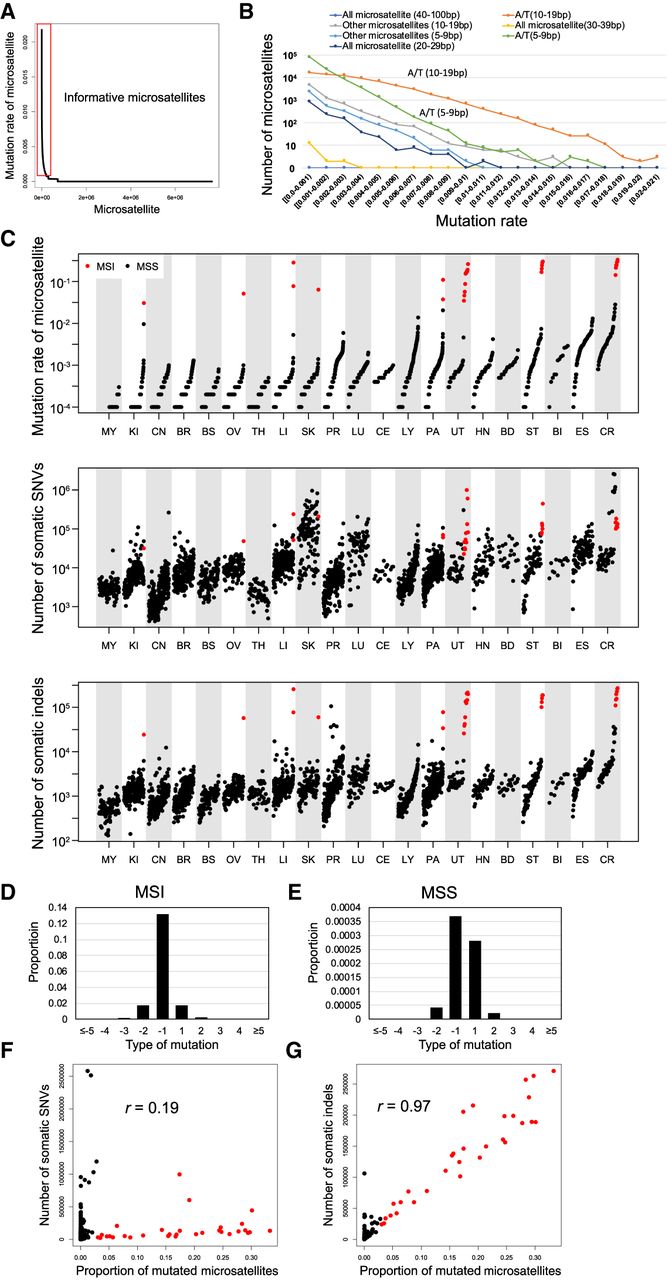
Pattern of somatic indels in microsatellite regions. (A) Mutation rate of each microsatellite; 7,650,128 microsatellites were sorted by the proportion of mutated samples. The red box indicates informative microsatellites defined in this study (proportion of mutated samples 0.001 or more). (B) Mutation rate among different microsatellites. Microsatellites are classified based on sequence of unit and length of each microsatellite in the reference genome. (C) Comparison of mutation rate of microsatellites and number of somatic SNVs and indels in different types of cancer. MSI samples are shown in red. (D,E) Pattern of insertions (positive change in repeat length in x-axis) and deletions (negative change in repeat length in x-axis) in microsatellites of the MSI (D) and MSS (E) samples. Correlation between the mutation rate of microsatellites and the number of somatic SNVs. Pearson product-moment correlation; r = 0.19, P-value = 1.6 × 10⁻²³. MSI samples are shown in red. (F) Correlation between the mutation rate of microsatellites and the number of somatic SNVs. Pearson product-moment correlation; r = 0.19, P-value = 1.6 × 10⁻²³. MSI samples are shown in red. (G) Correlation between the mutation rate of microsatellites and the number of somatic indels. Pearson product-moment correlation; r = 0.97, P-value < 1.0 × 10−200. MSI samples are shown in red.


