
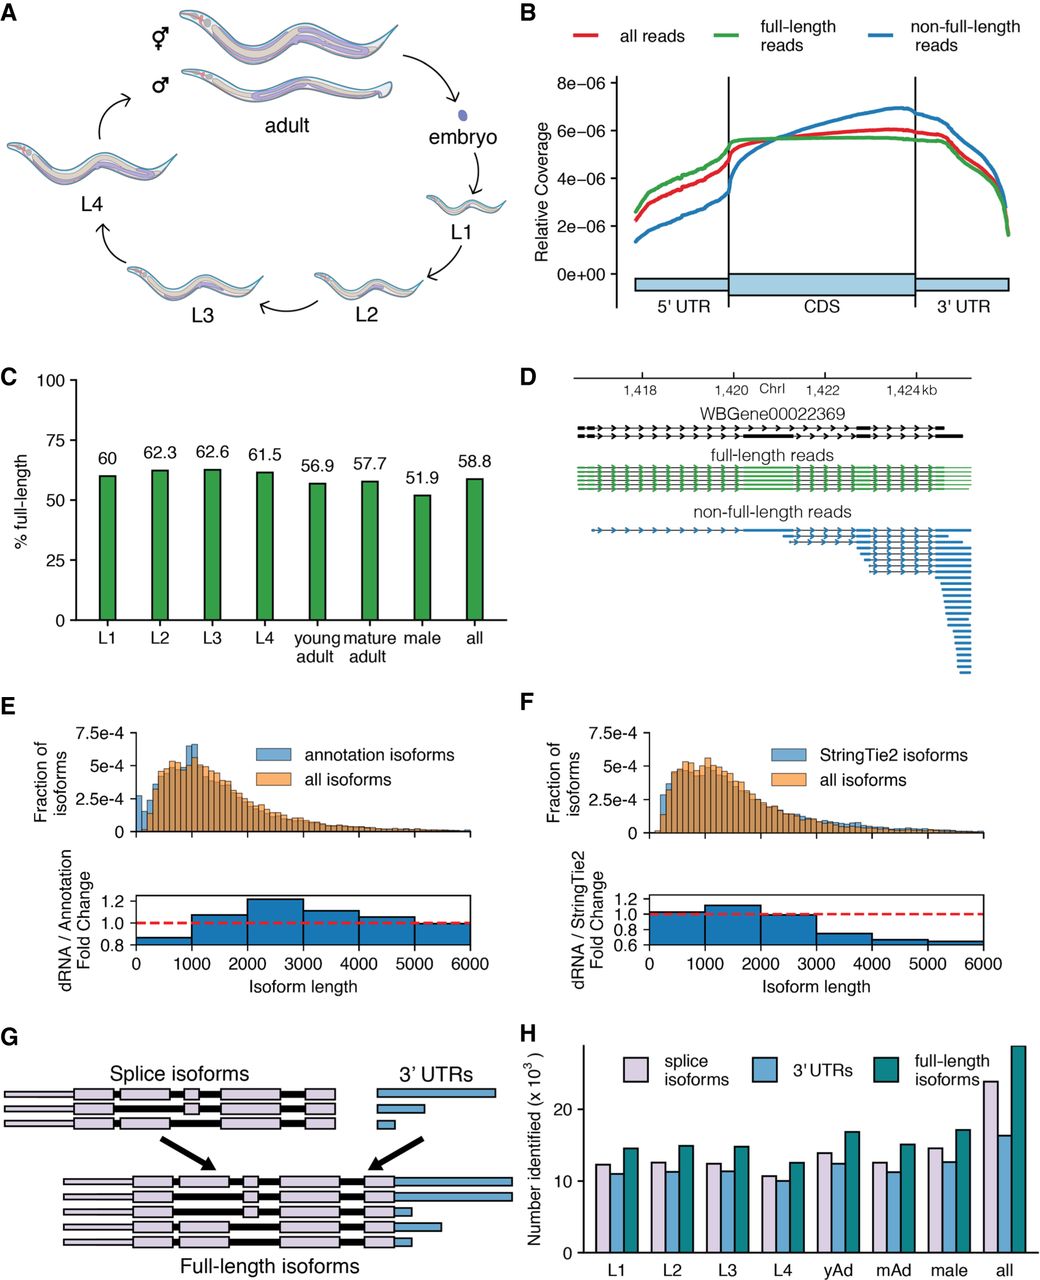
Overview of approach and sequencing of full-length isoforms. (A) Diagram of the C. elegans life cycle. (B) Plot of normalized coverage across the average coding gene with full-length (green), non-full-length (blue), and all reads (red) considered. (C) Percentage of reads that passed filtering and were called full-length in each stage. (D) Example locus showing reads aligning to the WBGene00022369 locus (black). (E) Comparison of length distributions of isoforms present in the WormBase WS265 annotation and splice isoforms identified by this study displayed as a density plot (top) and as the fold change of the densities (bottom). (F) As in E, comparison of length distribution of isoforms assembled by StringTie2 using Illumina-based RNA-seq from across C elegans development and splice isoforms identified by this study. (G) Schematic defining “full-length isoform” as a combination of splice isoform and 3′-UTR isoform. (H) Number of splice, 3′-UTR, and full-length isoforms observed across all stages. (yAd) Young adult, (mAd) mature adult. Exact numbers can be found in Supplemental Table 3.


