
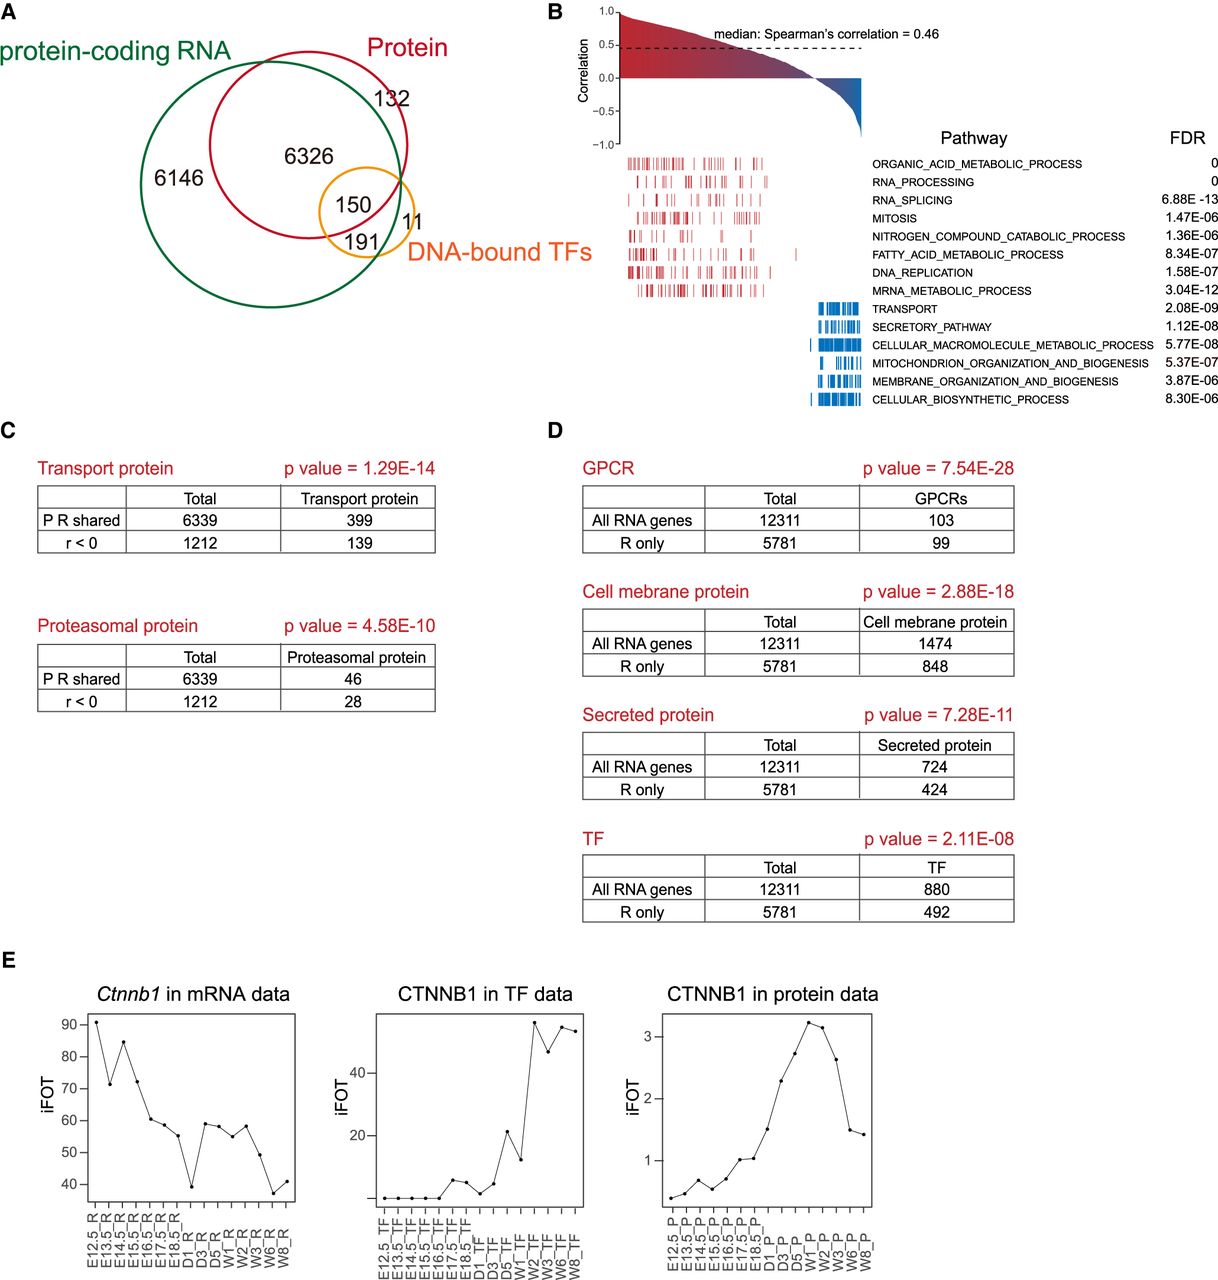
Integrative analysis of the transcriptome, proteome, and DNA-bound TFs. (A) Venn diagram of total number of transcripts, proteins, and the number of overlapping TFs detected in the TFRE pulldown data set. (B) Protein-mRNA correlation calculated by Spearman's correlation coefficient. Pathways in red are positively correlated (r > 0.3); pathways in blue are negatively correlated (r < 0). (C) Protein-mRNA levels of the transport proteins and proteasomal proteins are negatively correlated (r < 0). P-values were calculated by hypergeometric distribution. (D) P-values of GPCRs, cell membrane protein, secreted protein, and TFs in the RNA-only data set calculated by the hypergeometric distribution. (E) Temporal expression levels of CTNNB1 by the mRNA, transcription factor, and protein measurements.


