
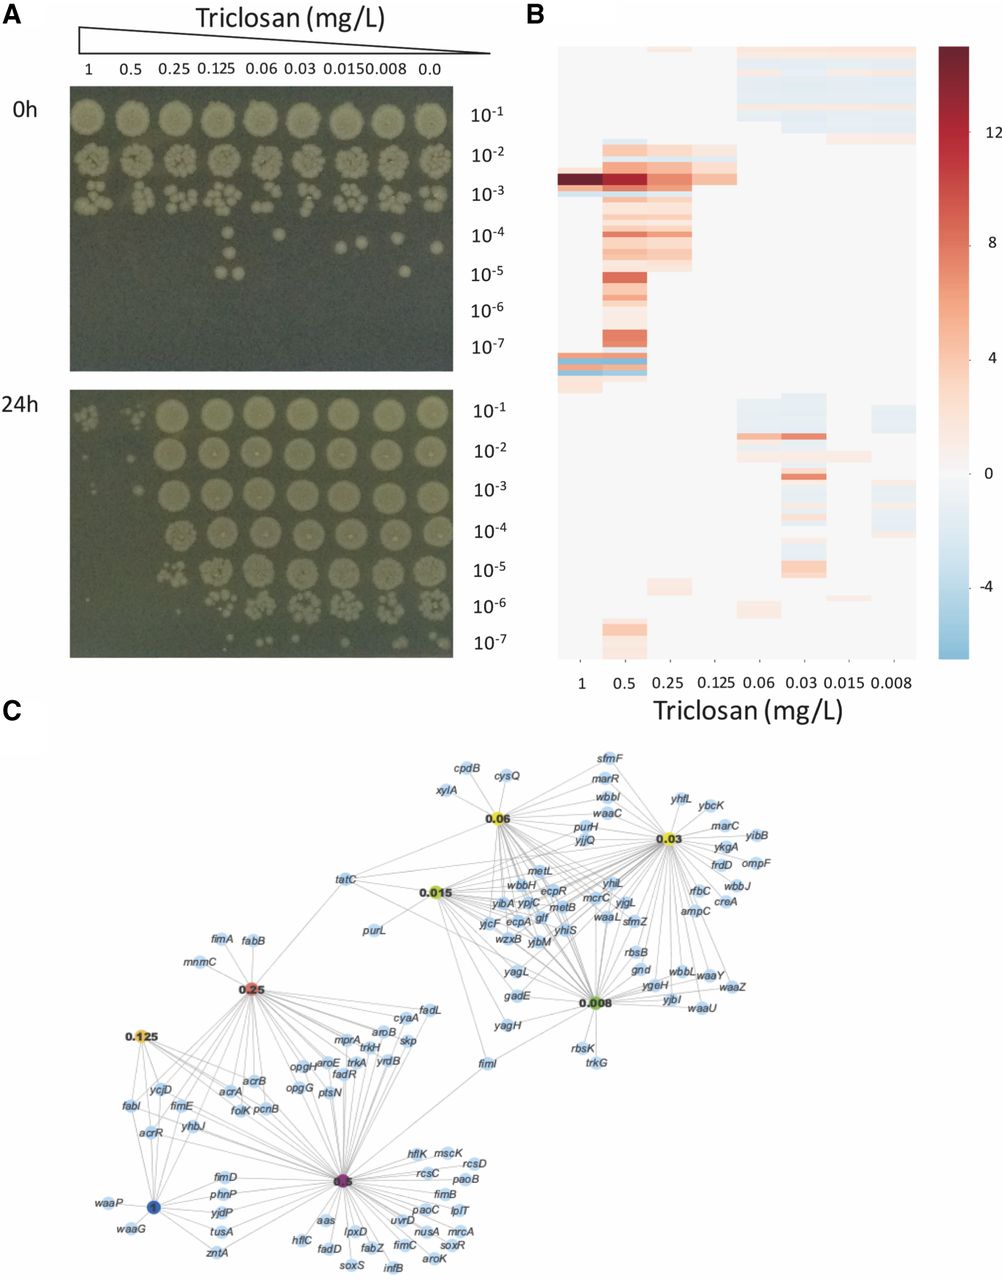
Dose-dependent activity of triclosan. (A) Viability of BW25113 from LB broth cultures supplemented with different concentrations of triclosan, immediately after inoculation (top) and after incubation for 24 h (bottom). Samples from the cultures were serially diluted 10-fold, and 5 µL of all dilutions was spotted onto LB agar and incubated. The level of dilution (from 10−1 to 10−7) is shown on the right side of the photographs, and the concentrations of triclosan in the cultures are shown along the top. The results show a bactericidal effect >0.5 mg/L; triclosan at 0.25 mg/L caused a 10-fold reduction in growth over the 24-h period, but at ≤0.125 mg/L, there was no growth inhibition. (B) Heat map highlighting differences in reads mapped to genes at the different triclosan concentrations shown along the bottom of the chart. Each row represents a gene, and genes are ordered from top to bottom. The intensity scale reflecting the size of difference is shown on the right of the map. (C) Network produced by the AlbaTraDIS software illustrating the genes identified as important at different concentrations of triclosan. Nodes represent genes (blue) or triclosan concentrations (indicated by colored nodes); edges show links between conditions and genes. The similarities of responses between sub-MIC and supra-MIC exposures are clearly visible.


