
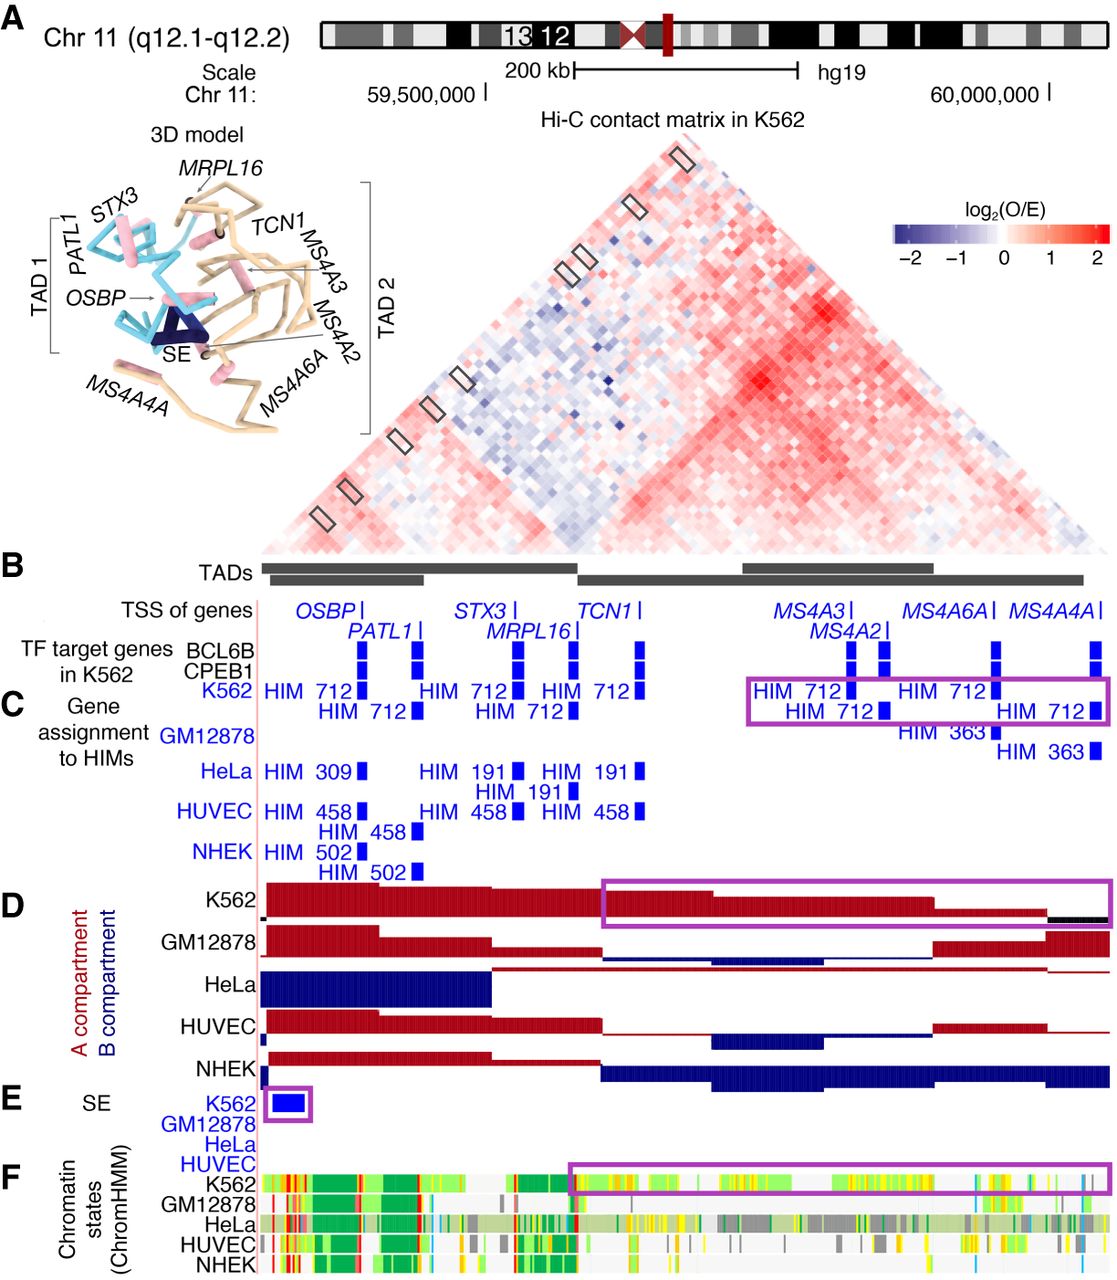
A K562-specific HIM with K562-specific chromatin interactome and functional annotations. (A) The 45° rotated upper triangle part of the contact matrix between the 10-kb-sized bins in a chromosome region in K562. The region is segregated into four nested TADs. The 3D model on top left is inferred by Chrom3D using 10-kb resolution Hi-C data. (B) Thin bars represent the transcriptional start sites (TSSs) of the genes that are in the heterogeneous networks. Thick bars represent the genes that are regulated by BCL6B or CPEB1 in K562. (C) The assignment of the genes to HIMs in K562 and the other cell types. (D) The assignment of the bins to A/B compartments. (E) The regions that are annotated as super-enhancers (SEs). (F) The chromatin states inferred by ChromHMM based on multiple histone modification marks, where red and purple colors represent promoters, orange and yellow stand for enhancers, green represents transcribed regions, and gray represents other types of regions such as repressed regions.


