
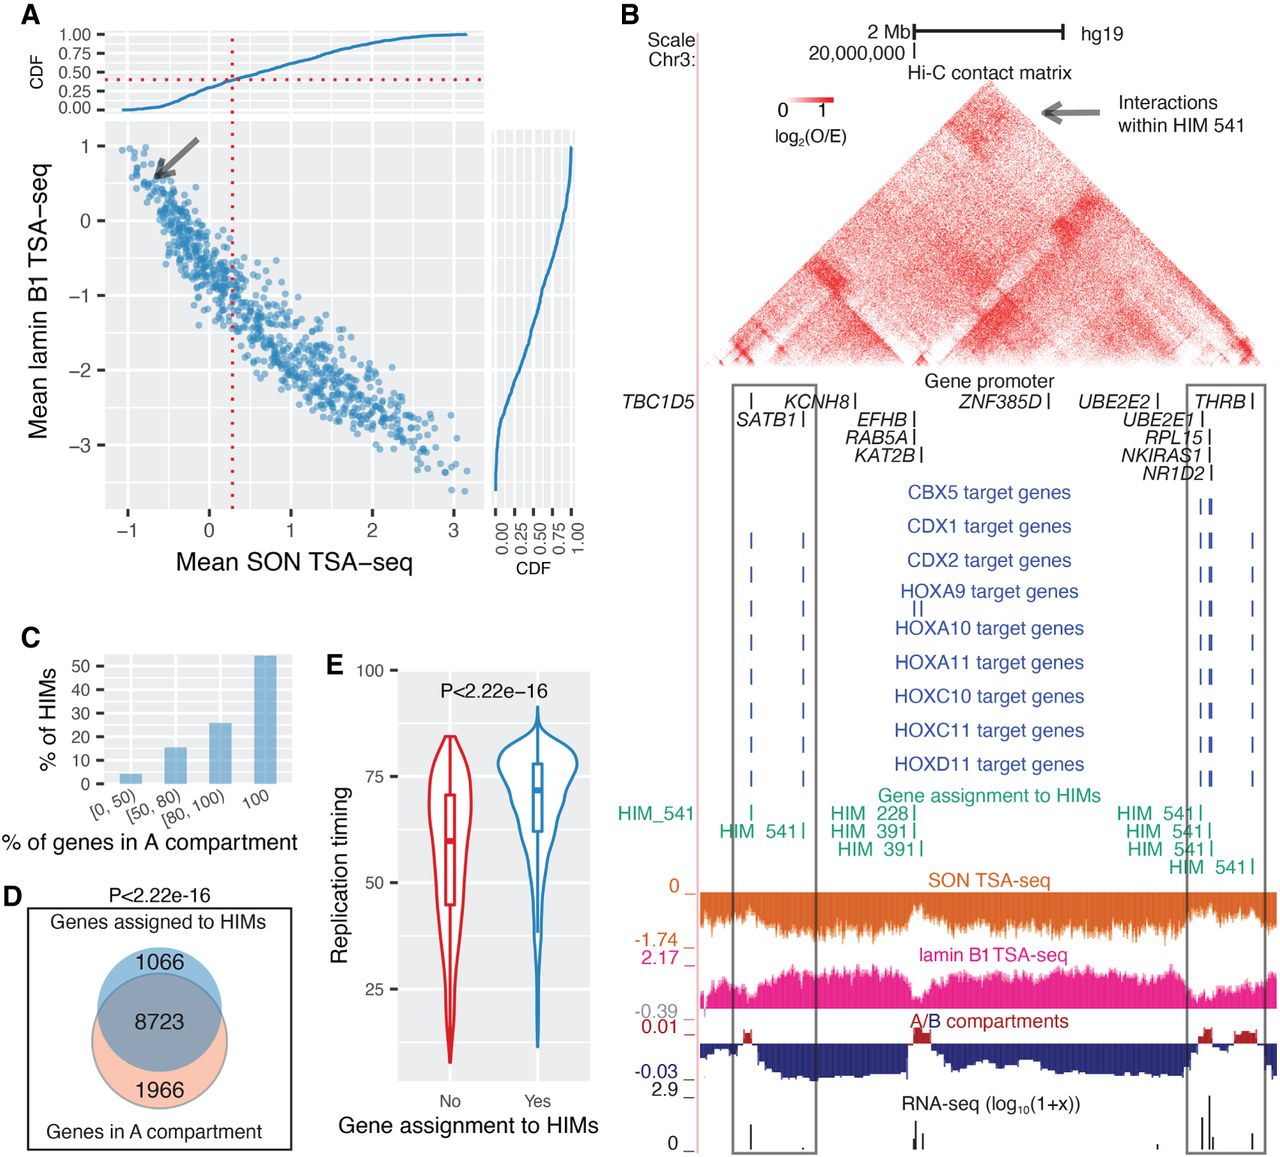
HIMs tend to be close to the nuclear interior, in particular, speckles. (A) Scatter plot shows the mean SON TSA-seq score and mean lamin B1 TSA-seq score of the genes in each HIM. Each dot represents a HIM. The curves on the top and on the right are cumulative density functions (CDFs). The red vertical dotted line represents the mean SON TSA-seq at 0.284 (approximately within 0.518 µm of nuclear speckles) (Chen et al. 2018). The black arrow points to HIM #541. (B) HIM #541 with low mean SON TSA-seq (pointed by the arrow in A). The heatmap shows the upper-triangle part of the Hi-C contact matrix (O/E) of the 10-kb-sized bins in the chromosome region that covers the genes in this HIM. Target genes of different TFs, gene members of HIM, SON TSA-seq, lamin B1 TSA-seq, A/B compartments, and RNA-seq signals are shown in different tracks. (C) Barplot shows the proportion of HIMs with a varied proportion of genes in the A compartment. (D) Venn diagram shows that the genes assigned to HIMs are enriched in the A compartment. (E) Violin and boxplot compare the replication timing of the genes assigned to HIMs and the other genes in the heterogeneous network of K562. Here the HIMs are identified in K562. The spatial localization features of HIMs in other cell types are in Supplemental Figure S9.


