
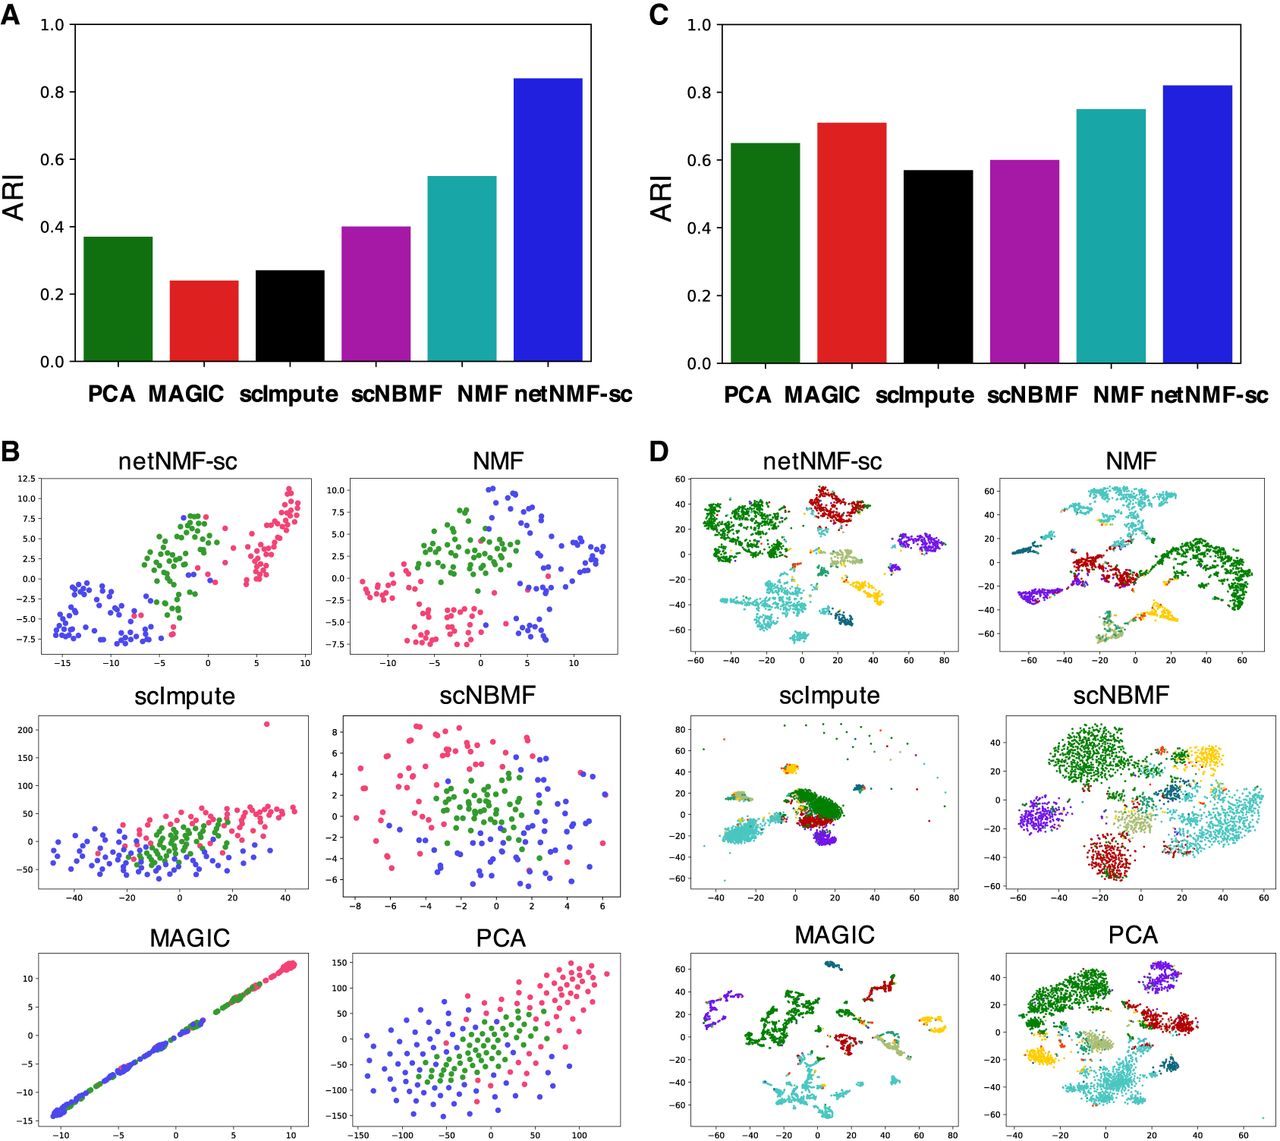
Figure 3.
Clustering performance on scRNA-seq data. (A) Adjusted Rand index (ARI) for cell clusters obtained by methods on mouse embryonic stem cell (mESC) scRNA-seq data from Buettner et al. (2015), with cell cycle labels obtained by flow sorting. (B) t-SNE projections of cells in reduced dimensional space. (C) Clustering results on brain cell data set from Zeisel et al. (2015) into nine cell types. (D) t-SNE projections of cells in reduced dimensional space.


