
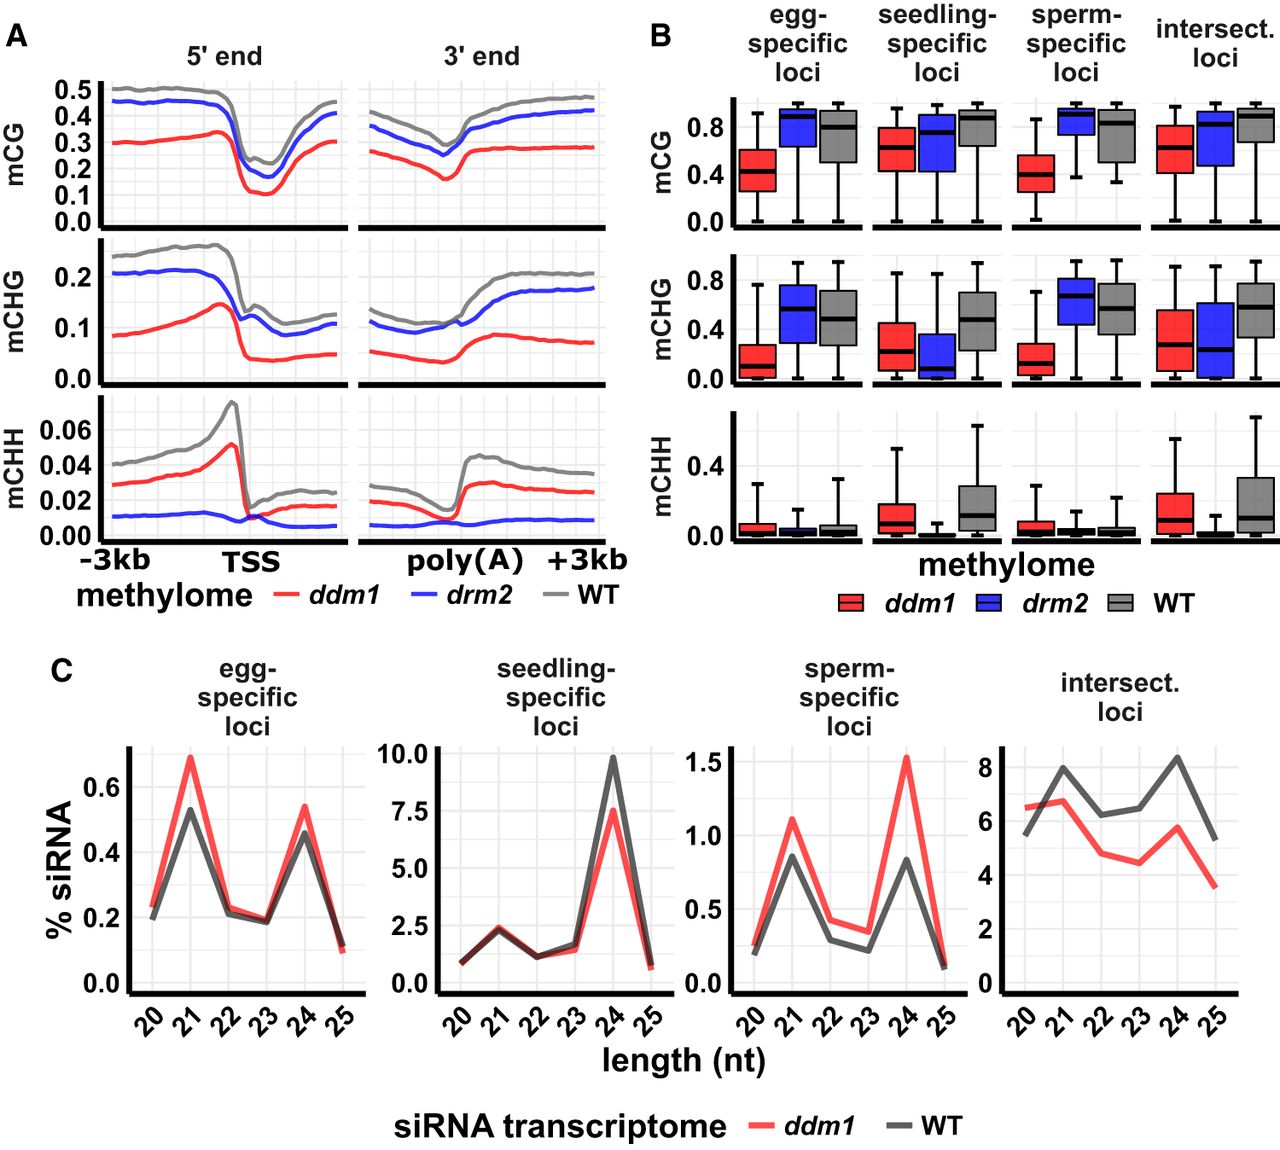
siRNA and DNA methylation in ddm1 mutant leaf. (A) DNA methylation metagene plots. Plots indicate average DNA methylation values over 100-bp intervals in ddm1 (osddm1a osddm1b double mutant), drm2, and wild-type leaf. Vertical grid lines indicate 500-bp intervals. DNA methylation is measured as the proportion of methylated cytosines relative to total cytosines in each sequence context. (TSS) Transcription start site, (poly[A]) polyadenylation site. Data source: Tan et al. (2016). (B) DNA methylation of 24-nt siRNA loci. Center line is median; box spans interquartile range; whiskers span 2.5th to 97.5th percentile. (C) siRNA abundance at 24-nt siRNA loci in ddm1 and wild-type leaf. “Intersect.” refers to intersection loci, those identified as 24-nt siRNA in all three tissues. y-axis values are percent of siRNAs of each length relative to the total number of siRNAs that mapped to the genome. Error bars are 95% confidence intervals. Data source: Tan et al. (2018).


