
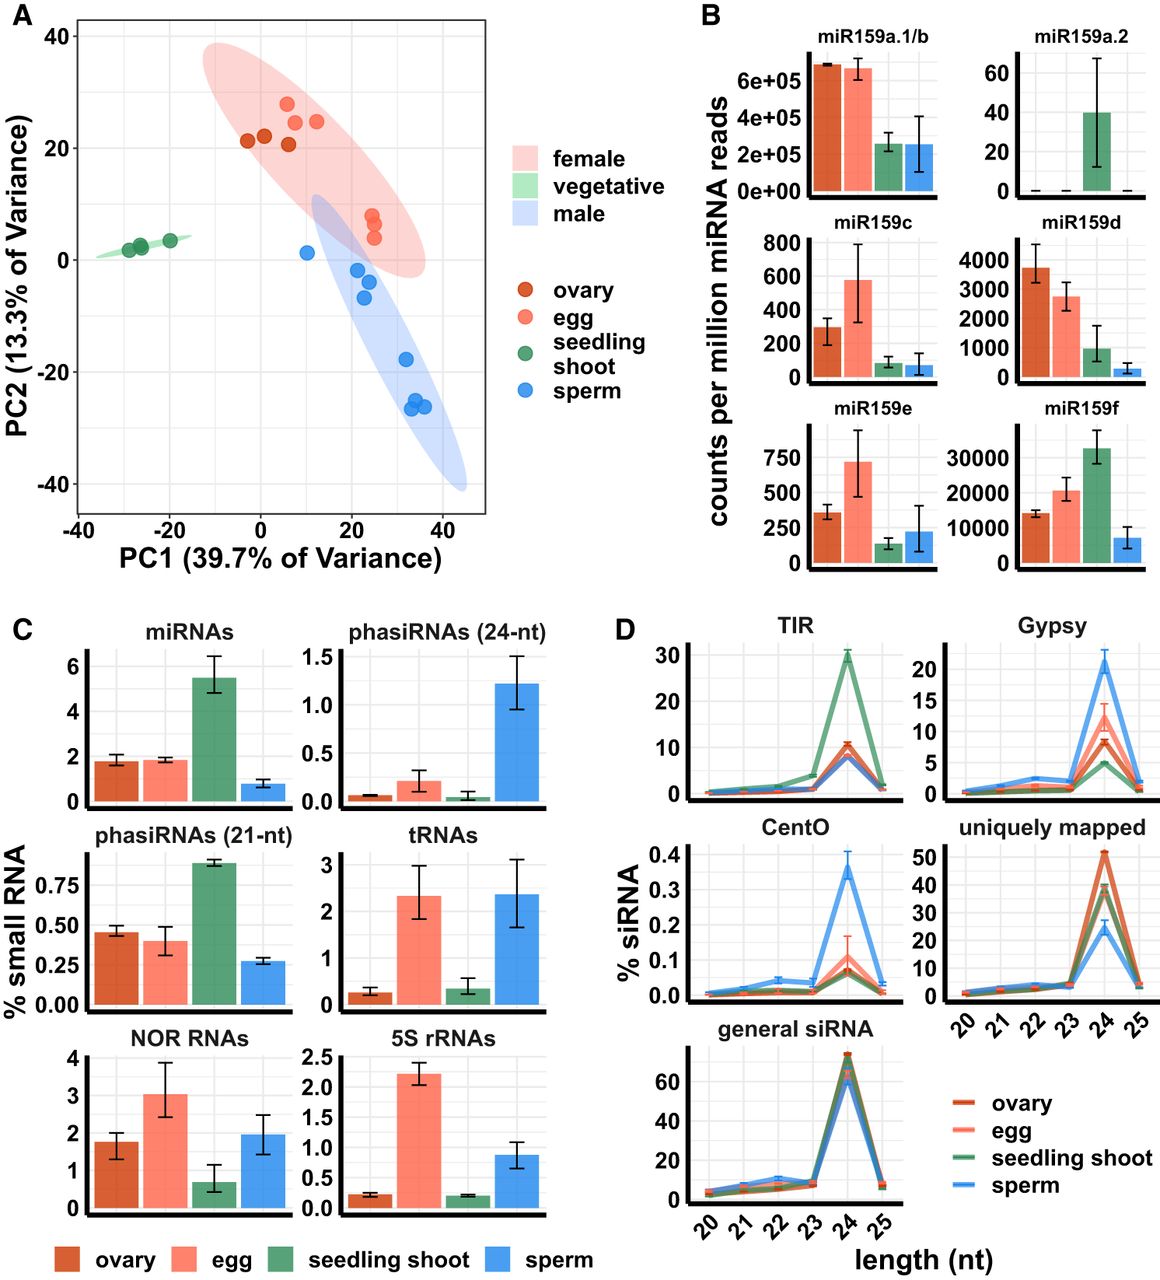
Small RNA composition of ovary, egg cell, sperm cell, and seedling shoot. (A) Principle component analysis (PCA) plot of tissues by miRNA expression pattern. (B) miRNA159 family expression. y-axis values are relative to the total number of miRNA reads in each tissue. Color code is the same as in A. (C) Small RNA compositions. y-axis values are relative to the total number of reads that mapped to the genome. (D) siRNA abundance by length and category. “siRNAs” refers to all 20- to 25-nt small RNAs that mapped to the genome but were not included in any category in C. “Uniquely mapped” refers to the subset that map with a MAPQ value of at least 20. “Gypsy” is the subset that overlaps with an annotated Gypsy element, and “TIR” is the subset that overlaps with an annotated DNA transposon of the Tc1/Mariner, PIF/Harbinger, Mutator, or hAT superfamilies. “CentO” is the subset that overlaps CentO tandem repeats. y-axis values are the number of siRNAs of each length normalized by the total number of siRNAs. In all panels, error bars are 95% confidence intervals based on biological replicates of each tissue.


