
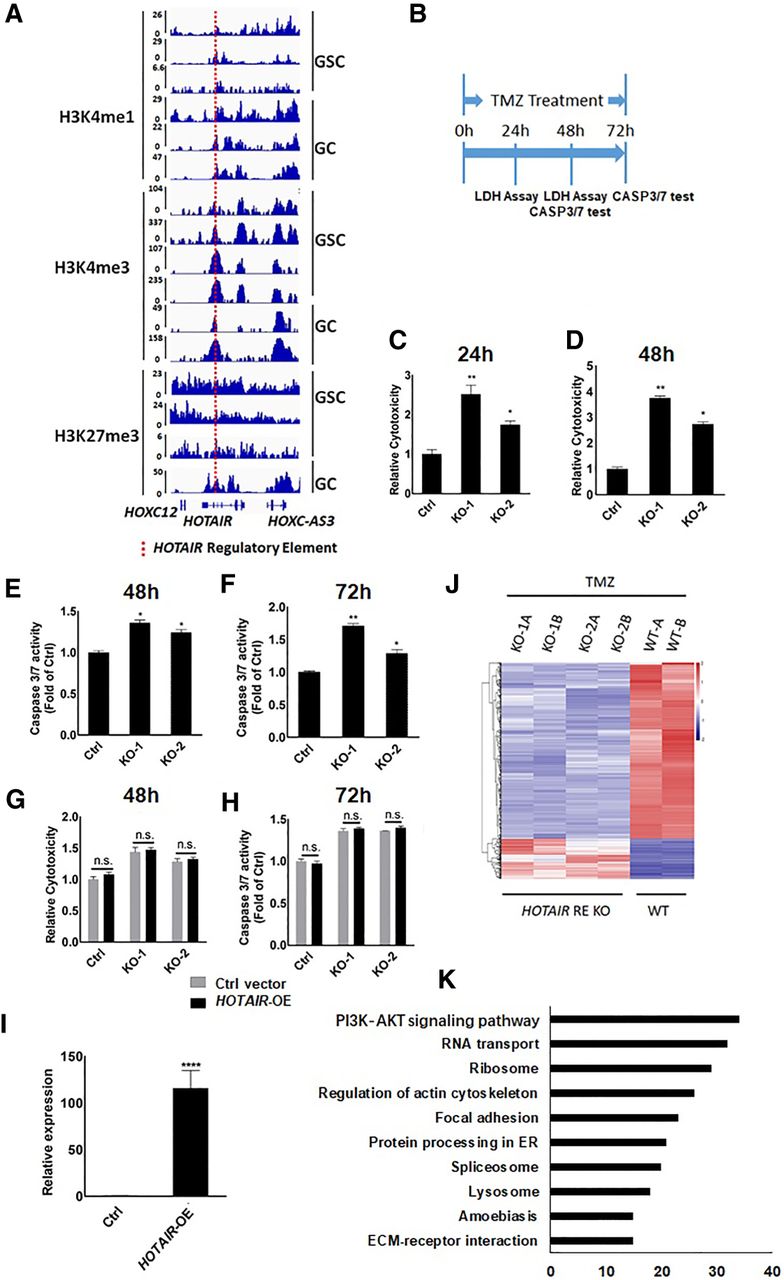
Deletion of the HOTAIR regulatory element increases glioma cells’ sensitivity to TMZ. (A) H3K4me1, H3K4me3, H3K27me3 ChIP of the region containing the HOTAIR regulatory element (red line) in glioma cells (GC) and glioma stem cells (GSC) derived from human tumor. (B) Schematic showing the timing of LDH and Caspase 3/7 assays. U251 glioma cells were treated with TMZ (1 mM) for 24–72 h. (C,D) An LDH assay was used to detect LDH release in wild-type U251 cells (Ctrl) and HOTAIR regulatory element knockout U251 lines (KO-1, KO-2). LDH release was assayed after cells were treated 24 h and 48 h with TMZ (1 mM). Data represent means ± S.E.M. of three independent experiments. (*) P < 0.05, (**) P < 0.01 compared with control. (E,F) Proteolytic activities of caspase 3/7 were tested in wild-type U251 cells (Ctrl) and HOTAIR regulatory element knockout U251 cells (KO-1, KO-2) treated 48 h and 72 h with TMZ. Data represent means ± S.E.M. of three independent experiments. (*) P < 0.05, (**) P < 0.01 compared with control. (G) LDH assay was used to detect LDH release in wild-type U251 cells (Ctrl) and HOTAIR regulatory element knockout U251 lines (KO-1, KO-2) with HOTAIR overexpression (HOTAIR-OE) or transfected with control vector. LDH release was tested after cells were treated 48 h with TMZ. Data represent means ± S.E.M. of three independent experiments. (H) Proteolytic activities of caspase 3/7 were tested in wild-type U251 cells (Ctrl) and HOTAIR regulatory element knockout U251 cells (KO-1, KO-2) with HOTAIR overexpression (HOTAIR-OE) or transfected with control vector. Caspase 3/7 activities were tested after cells were treated 72 h with TMZ. Data represent means ± S.E.M. of three independent experiments. (I) RT-qPCR analysis of HOTAIR in wild-type U251 cells transfected with control plasmid or HOTAIR overexpression plasmid. Data represent means ± S.E.M. of three independent experiments. (****) P < 0.0001 compared with corresponding cells transfected with Ctrl vector. (J) Comparison of gene expression in TMZ-treated (1 mM, 72 h) HOTAIR regulatory knockout (KO) and wild-type (WT) cell lines. Heat map shows clustering of differentially expressed genes in KO and WT glioma cells. KO-1A and B, KO-2A and B, WT-A and B refer to two biological replicates, respectively. (K) Function of genes (Q-value < 0.01) as analyzed by DAVID.


