
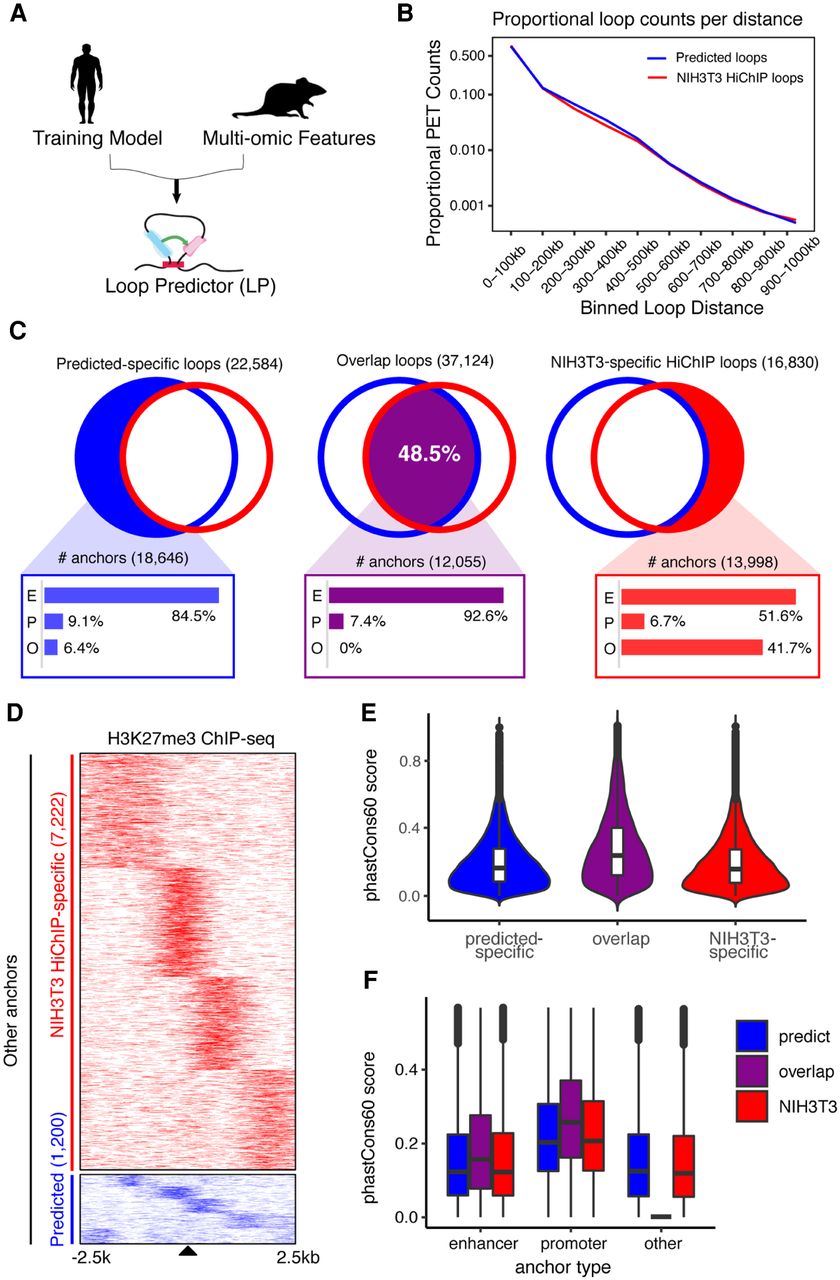
Cross-species long-range chromatin loop predictions. (A) Diagram for cross-species chromatin predictions. The adaptive training model implemented previously and trained on human cell lines was combined with multi-omics data from murine NIH3T3 myofibroblasts as input for LoopPredictor. (B) Proportional loop counts per distance for predicted and NIH3T3 HiChIP loops. Loops were binned by 100 kb to calculate the proportion. (C) Venn diagrams depicting the amounts of predicted-specific loops (22,584), overlapping loops (37,124), and NIH3T3-specific HiChIP loops (16,830). The common loops accounted for 48.5% of the total loops. The bar plots shown below indicate the composition of anchor types from each loop set. (E) Enhancer type, (P) promoter type (P), (O) other type. (D) Heat map for H3K27me3 ChIP-seq signal over O-type anchors in NIH3T3 HiChIP-specific and predicted-specific loops found in C. The number of O-type anchors in NIH3T3 HiChIP-specific and predicted-specific sets are 7222 and 1200, respectively. ChIP-seq signals were visualized across a 5-kb window. (E) Violin plots of conservation scores across anchor types. Anchor regions derived from C. (F) Boxplot for conservation scores by anchor type derived from C.


