
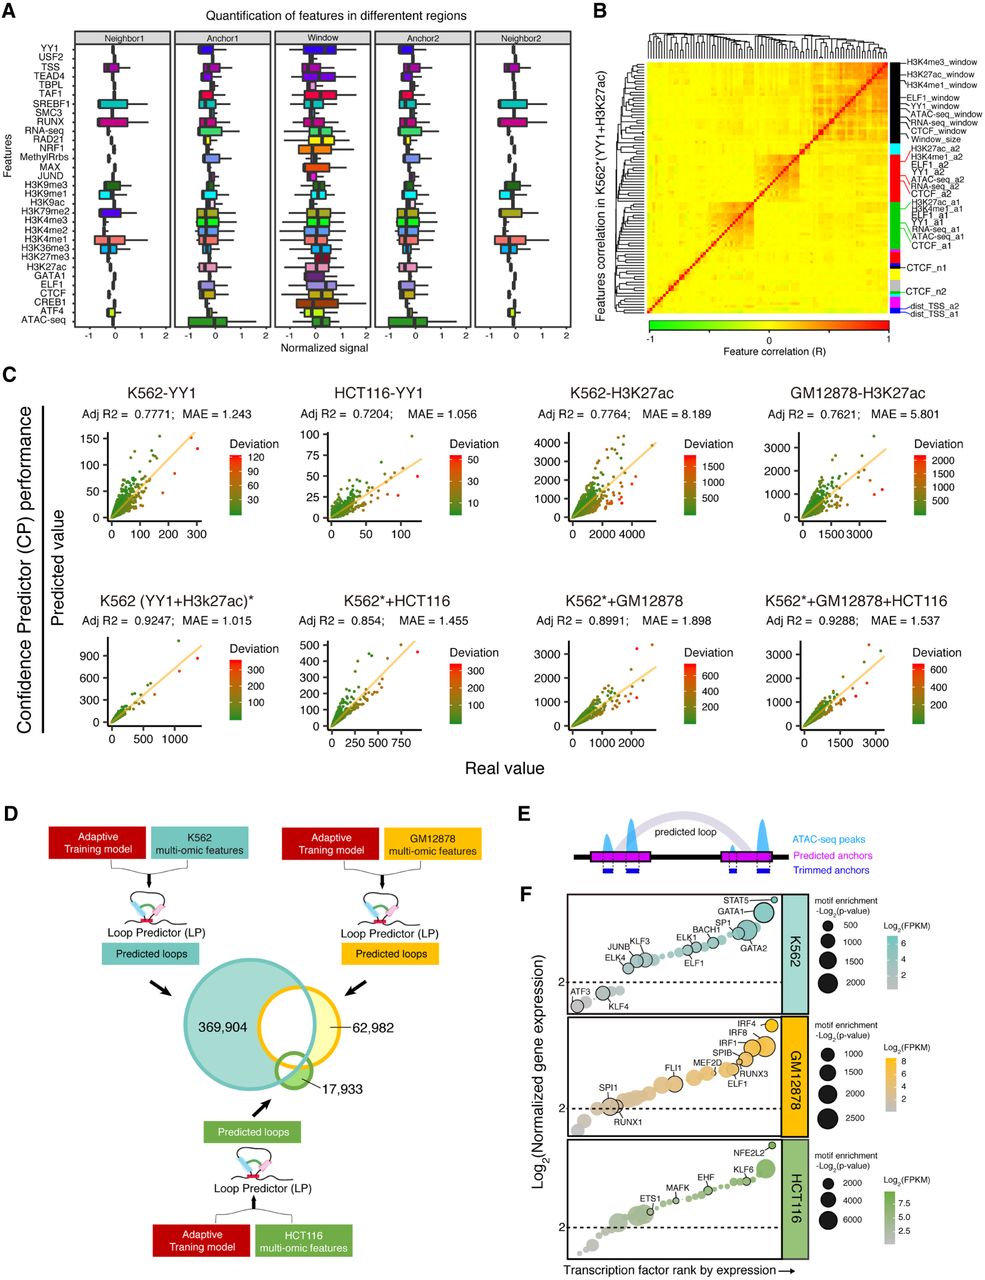
The performance of Confidence Predictor. (A) Quantification of features across different loop-associated regions. The signals of features were normalized by z-score. (B) Pearson's correlation and hierarchical clustering for the features of K562*(YY1 + H3K27ac). The colored bars on the right side indicate hierarchical clusters. Colored bars at the bottom demarcate the feature correlation coefficient, R. (C) Prediction performance evaluation for CP in four individual data sets (upper) and four integrated data sets (lower). (D) Evaluation of LoopPredictor for identifying cell type–specific loops. Our adaptive model and the multi-omics features derived from three individual cell lines were fed into LoopPredictor to perform predictions. The results from each cell type were marked by different colors in the Venn diagram. The number of predicted cell type–specific (K562, GM12878, HCT116) loops were 369,904, 62,982, and 17,933, respectively. (E) Diagram for trimming anchors with ATAC-seq peaks to identify loop binding transcription factors. (F) Transcription factor enrichment analysis for cell type–specific predicted loops. Cell type–specific loops identified in D. Transcription factors were ranked by normalized gene expression. The size of each point indicates the motif enrichment P-value. The color of each point codes for the normalized expression of the indicated transcription factor. The threshold of motif enrichment was −log2(P-value) > 500, and the threshold for gene expression was set to log2(FPKM) > 2.


