
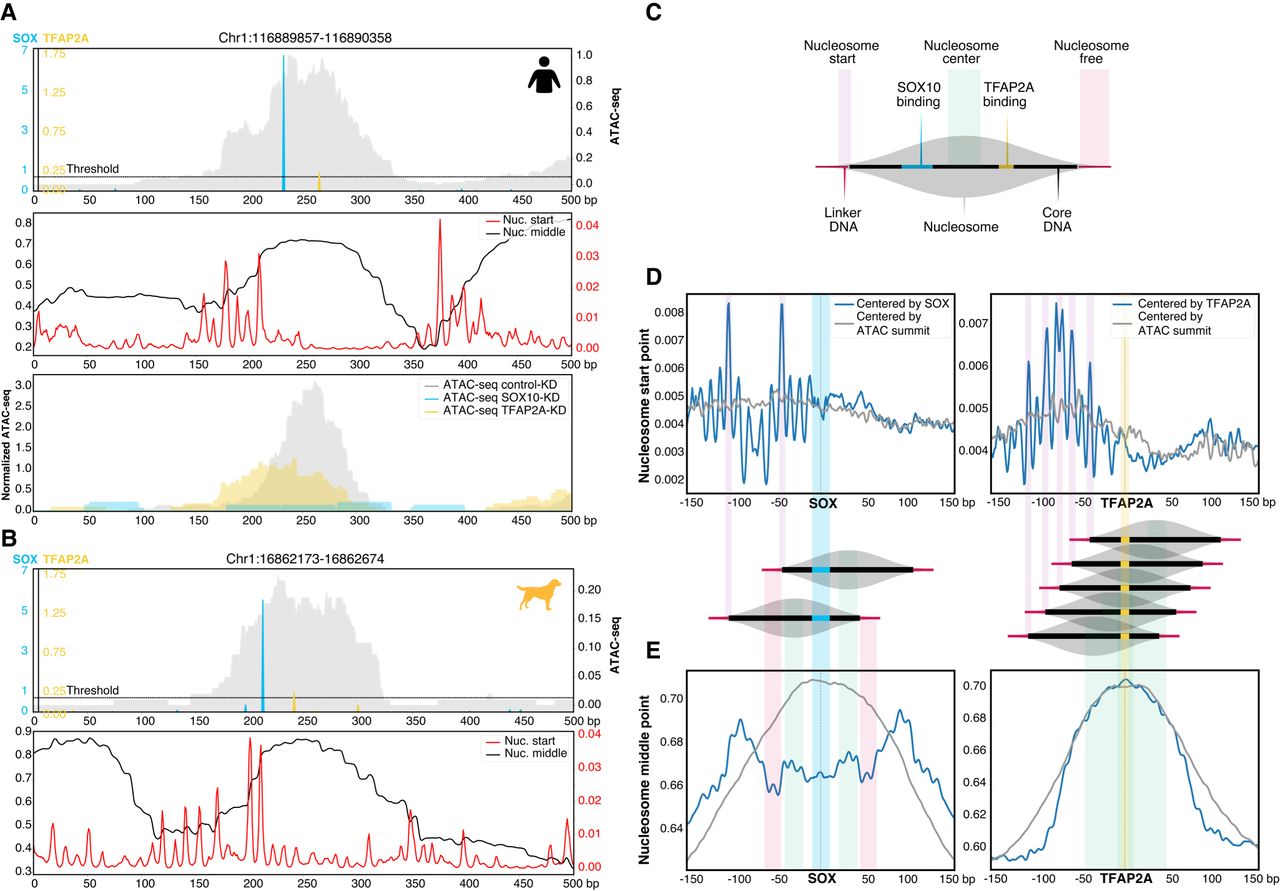
Positional specificity of SOX10 and TFAP2A in MEL melanoma enhancers. (A,B, top) Example human (A) and dog (B) MEL-predicted enhancer containing significant SOX10 and TFAP2A motifs. The ATAC-seq signal is shown in gray. (A, middle; B, bottom) Imputed nucleosome start and middle point profiles. (A, bottom) For the human example region, ATAC-seq profiles of MM001 in control condition, after 72 h of SOX10 knockdown or TFAP2A knockdown are shown. (C) Schematic overview of the nucleosome structure explaining the colors used in D and E. (D,E) Nucleosome start point (D) and nucleosome middle point predictions (E) on MEL-predicted regions containing one SOX10 (left) or one TFAP2A motif (right) next to possible other motifs, where the regions are either centered on the ATAC-seq summit (gray) or on the SOX10 or TFAP2A motif (blue).


