
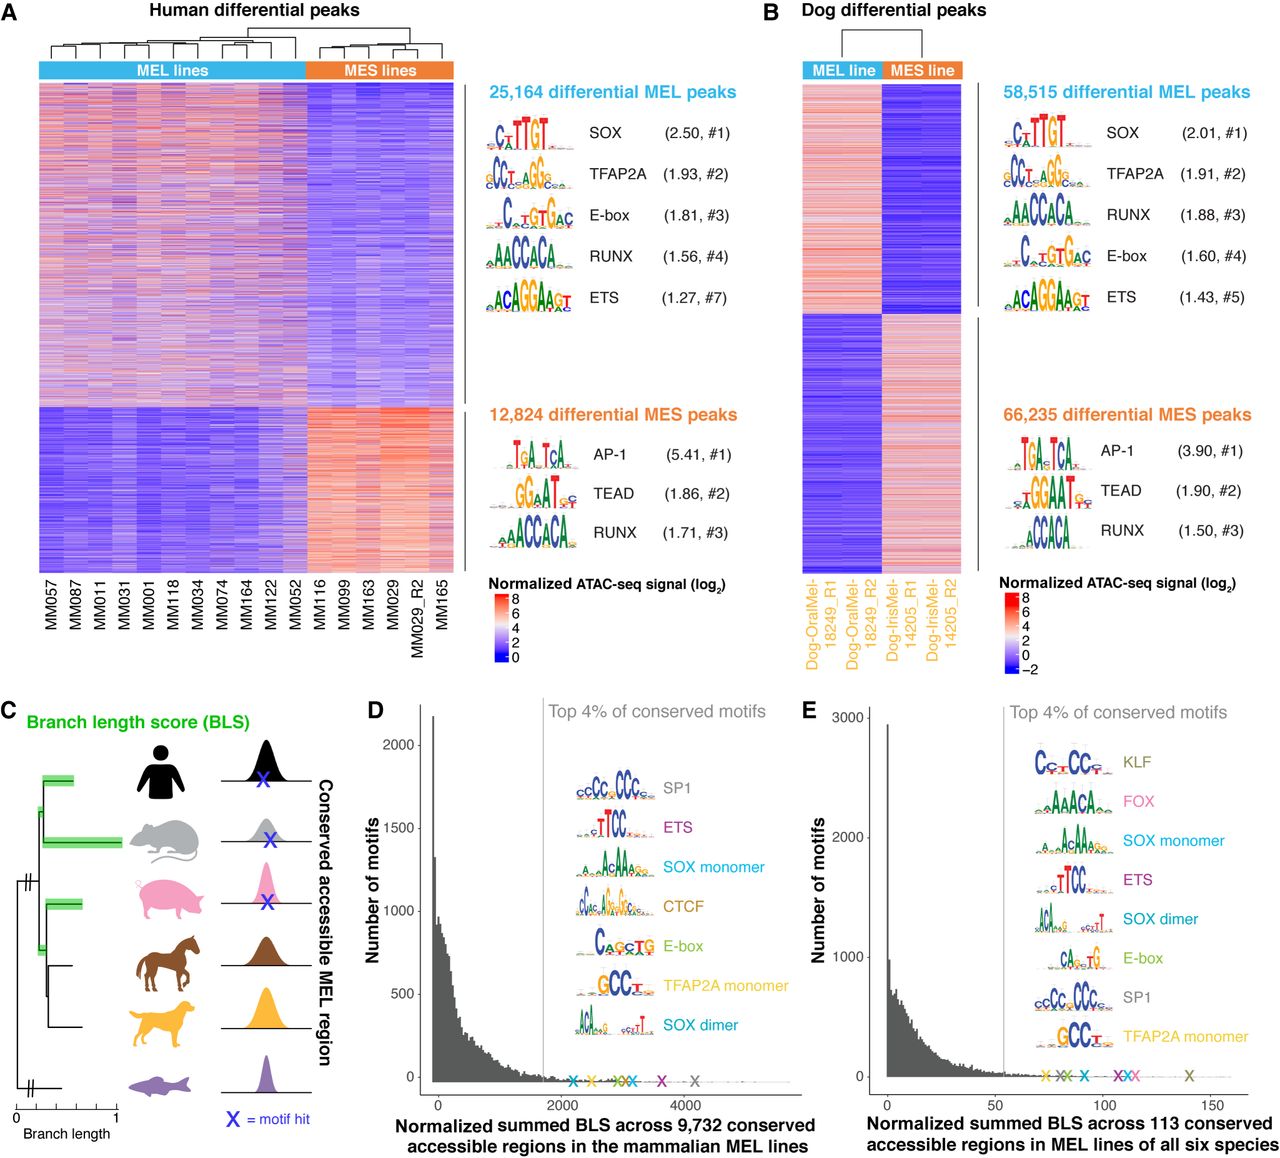
Conservation of binding motifs of master regulators of MEL and MES melanoma states. (A,B) Heatmap of differential ATAC-seq regions when comparing human MEL versus human MES lines (A) and the MEL dog line “Dog-OralMel-18249” versus the MES dog line “Dog-IrisMel-14205” (two biological replicates each) (B), colored by normalized ATAC-seq signal. Enriched TF binding motifs in the differential peaks were identified via HOMER (Heinz et al. 2010), and the first logo of enriched TF families is shown. The ratio of the percentage of target and background sequences with the motif is indicated between brackets, as well as the rank of the TF class within the HOMER output (#). (C) Schematic overview of cross-species motif analysis using the branch length score (BLS) as a measure for the evolutionary conservation of a motif hit across conserved accessible regions. The BLS was summed across a set of conserved accessible regions. (D,E) Histogram of the normalized summed BLS score for 20,003 motifs on 9732 conserved accessible regions across the mammalian MEL lines (D) and on 113 conserved accessible regions across MEL lines of all six species (E). The first hit of the top recurrent TF binding motifs within the top 4% conserved motifs is indicated as a cross and is accompanied by the logo of the motif.


