
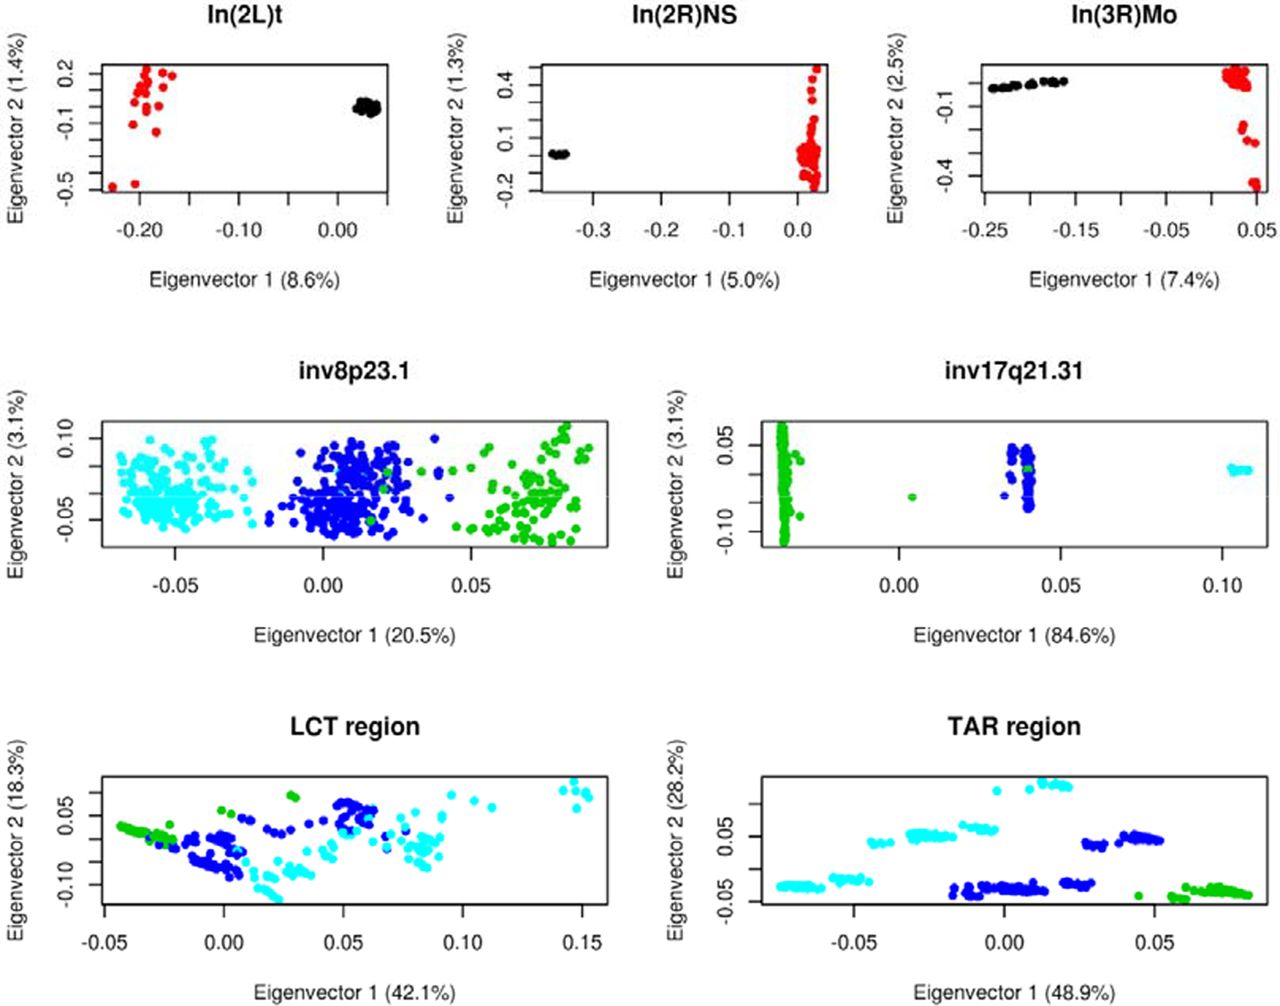
Figure 6.
recombClust classification recovers the population structure detected by principal component analysis (PCA) of SNP data. In D. melanogaster inversions [In(2L)t, In(2R)NS, and In(3R)Mo], each point represents the first two principal components of an inbred line, colored by recombClust classification: (black) subpopulation 1; (red) subpopulation 2. In humans, each point represents the first two PCs of a diploid individual colored by the recombClust classification: (green) subpop1/subpop1; (blue) subpop1/subpop2; (cyan) subpop2/subpop2.


